 TEXTILES.ORG

Emerging technology
Introduction
Mechanically stabilized earth (MSE) walls with large concrete panel facing, reinforced with polyester straps, is an emerging technology in the U.S. To enable the design of this wall system using AASHTO’s methodology, its classification of extensibility must be established. This empirical classification results in adequate internal stability.
Internal design of MSE walls determines the magnitude and location of the maximum load in each reinforcement layer, Tmax. In each layer, Tmax is a function of the properties of the backfill soil (frictional shear strength, φ, and the self-weight expressed through unit weight, γ), the surcharge loading anticipated during the life of the structure, and the wall geometry (e.g., batter, backslope). 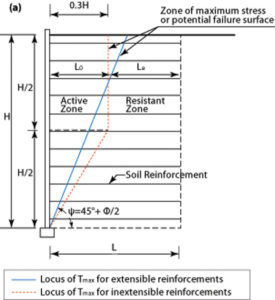
The value of Tmax enables the designer to select reinforcement that has adequate long-term strength. Furthermore, Tmax is used in calculating the pullout resistive length and the required strength of the connection between the reinforcement and the facing. Clearly, Tmax is a key value in design.
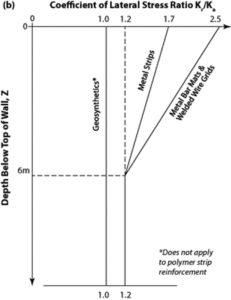
Generally, design of MSE walls in the public sector in the U.S is based on AASHTO. AASHTO broadly categorize reinforcement as extensible (mainly geosynthetic) and inextensible (mainly metallic). AASHTO categorization is empirical and new MSE systems have to establish their category based on field data. Two criteria are used in AASHTO for classification. One is the locus of Tmax (Figure 1a) and the second is the distribution of the lateral earth pressure coefficient, Kr, with depth, normalized relative to Rankine’s active pressure coefficient, Ka (Figure 1b). Note that polymer strip reinforcement is not included. The coefficient Kr is empirically based. Tmax is calculated in design as Tmax= σh Sv = KrσvSv where, for a given reinforcement layer, σh is the average horizontal stress within the contributory vertical spacing, Sv, and σv is the average overburden pressure at the layer’s elevation. The value of Kr is established from field measurement of Tmax while using known Sv and σv to back-calculate Kr for each system category. Establishing the empirical Kr for a system, its value then is divided by Ka to get a normalized Kr/Ka and thus assumed to generalize its value for any acceptable backfill.
Reported here is a summary of field measurements of Tmax to categorize a wall system reinforced with polyester straps with large precast concrete panels. Data was recorded during and well after the end of construction, enabling direct assessment of Kr as well as the relative location of Tmax.
Instrumented wall
Background
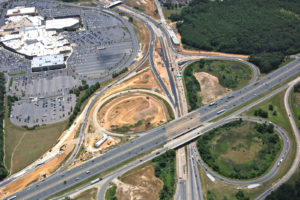
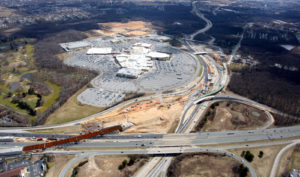
A new highway interchange opened to traffic in 2013 at the confluence of Interstate 95 and state highways 1/7 in Christiana, New Castle County, Del. Due to limited space within the existing roadways and required skewed flyover alignment, 16 MSE walls, providing access to 12 bridge abutments, were constructed.
The MSE walls included large precast concrete panels and high tenacity polyester straps as soil reinforcement. Because it was not known whether this wall system should be categorized as extensible or inextensible, the design was conducted once assuming it was extensible and once it was inextensible, ultimately specifying for construction the stricter outcome. The design methodology followed LRFD as detailed in AASHTO 2007 using program MSEW(3.0).
Recognizing the need to empirically categorize this wall system, Delaware Department of Transportation (DelDOT) required that one wall section (Section 4, Wall 7) be instrumented. The construction of the instrumented section was completed in October 2012 with placement of pavement, coping, and barriers done a few months later.
from facing) of backfill.
from facing) of backfill.
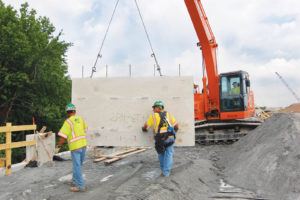
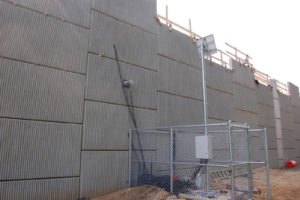
Facing panels
Figure 2 shows a typical precast facing panel. At the instrumented section, the panels were 3m (10ft) wide × 1.5m (5ft) high × 140mm (4.6in.) thick. Reinforcement was connected to the panels through two rows of four loop-type U-shaped metallic connectors, spaced vertically 0.76m (2.5ft).
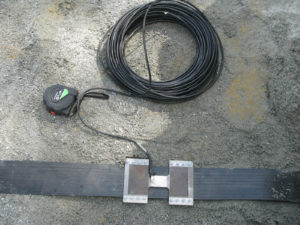
Reinforcement
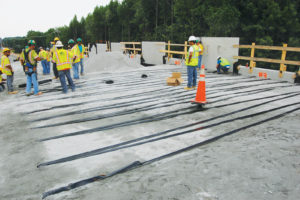
Reinforcement straps were 8.5m (28ft) with vertical spacing of 0.76m (2.5ft). Figure 3 (pp. 32 and 36). illustrates the layout of the straps. This proprietary reinforcing strap consists of high-strength polyester filaments protected by a polyethylene coating.
Backfill
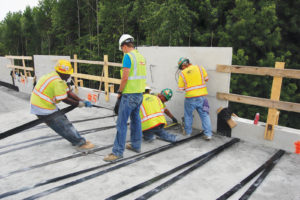
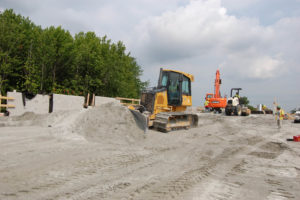
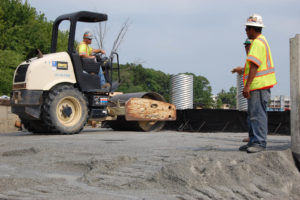
Well-graded coarse sand, having about 15% passing sieve 200, was used. It was compacted to 100% Standard Proctor (although 95% was specified). Direct shear tests indicate an internal friction angle of 50 degrees. Figure 4 shows compaction away from the facing. A 1-ton handheld compactor was used within 1m from the facing.
Instrumentation
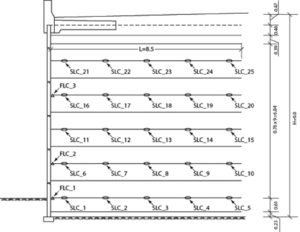
Figure 5 shows the layout of the load cells relevant for the objective of the study reported here.
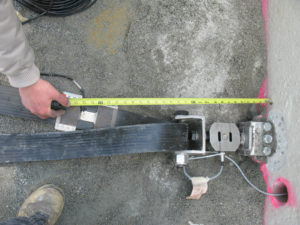
General instrumentation included load cells attached to the reinforcing strap (SLC) to yield the force in a strap at a particular location and load cells directly connected between the V-shaped strap and its attachment to the loop-connector (FLC) to yield the load at the connection to the concrete pane.
Instrumentation also included a 4-bar soil extensometer to indicate horizontal movement of the reinforced soil pressure cell to measure vertical and horizontal earth pressures and temperature sensors to evaluate its effects on the data collected. Generally, the extensometers indicated that post-construction outward movement of the facing at mid-height was <10mm.
Figures 6a and 6b show the strap and facing load cells. Note that SLC was strain gaged full-bridge epoxy glued to metal plates. The area of the plates was designed to produce sufficient sensitivity for reliable reading of data. The two plates comprising each load cell were placed on opposite sides of the strap and clamped tightly by bolts (see Figure 6a). The connector load cell was a commercial type, connected by a hook to the metal loop extending from the concrete panel. On the backfill side this load cell was connected to the strap through a customized metal loop, essentially creating a V-shaped connection of the strap as in all locations without such a load cell.
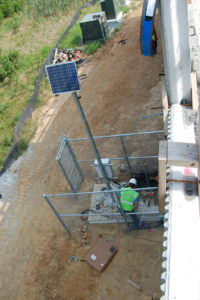
Installation and monitoring of the instrumented section started in April 2012, at the beginning of construction. Output of embedded sensors was recorded numerous times daily using a Web-connected data acquisition system (Figure 7). Period 1 is defined until Nov. 2, 2012, when the wall was about 8.2m tall. Period 2 is defined between Nov. 2, 2012, and Sept. 13, 2013, when construction was finished and the bridge was open to traffic for about a month. Period 3 is defined between September 13, 2013, and June 14, 2014, when recorded data continued under normal service operating condition. Figure 7 provides an overview of the Web-connected computerized data acquisition station, powered by a battery and a solar panel, some of the facing panels, the cables emerging through the facing while connected to the embedded load cells, and the outer casing of the extensometer.
Interpretation of measured data
This article relates to two publications: (1) Luo, Leshchinsky, Rimoldi, Lugli, and Xu, “Instrumented MSE Wall Reinforced with Polyester Straps,” presented at the TRB annual meeting in 2015 as well as in press in the Transportation Research Record (TRR) 2015, and (2) Rimoldi, Leshchinsky, Arrigoni, Bortolussi, “Vertical Wall with Concrete Panels Facing and Geostrips Reinforcement: Instrumentation and Data Reduction,” Proceedings of the Design and Practice of Geosynthetic-Reinforced Soil Structures, Bologna, Italy, 2013, 243–260. Consequently, for detailed procedures of data reduction and further interpretation, the reader is referred to these two articles.
Locus of Tmax
The location of Tmax at each elevation is part of the design process because it signifies the starting point from which pullout resistive length is calculated (Figure 1).
The locus of Tmax is also related to extensibility. Strictly, the location of Tmax was scattered when connecting measured data points at various elevations. Furthermore, the value of Tmax in most layers did not represent a distinctive peak value; i.e., the measured data indicated a flat maximum value for T, implying that practically a range of locations could be used to reasonably define the locus of Tmax. In fact, for friction angle of 50 degrees, the locus for extensible and inextensible is quite close although one is linear line and the second is bilinear (Figure 1). Subsequently, the loci criterion was deemed unrealizable for categorization.
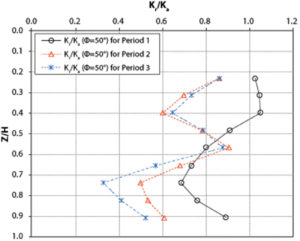
Calculated Kr/Ka
Based on measured Tmax, Kr could be assessed and then Kr/Ka calculated using ϕ=50 degrees. Figure 8 shows Kr/Ka calculated for the three periods in which data was measured.
At the end of construction (Period 1) the ratio is maximum practically representing Kr=Ka, categorized as extensible reinforcement in AASHTO (Figure 1). With time Kr dropped somewhat, probably due to backfilling of the trench for the leveling pad at the end of Period 1 which effectively decreased the height of the wall and load in the reinforcements for Periods 2 and 3. Also, the load could have dropped due to some movements of the leveling pad and the backfill soil leading to stress relaxation in the reinforcement as other components in the system carry more load. The observed movements due to system shakedown were small (r/Ka = 1.0 should be used.
Web-connected, solar-powered, computerized data acquisition station.
Mobilized reinforcement strength
A direct evaluation of internal design can be done by comparing the long-term allowable strength of the reinforcement with the actual measured load.
This ratio is the factor of safety on the reinforcement strength, usually specified in design as a minimum of Fs=1.50. The designer used reduction factors for creep considering 120 years, installation damage, and durability, equal to 1.39, 1.10 and 1.10, respectively. Considering the ultimate strength of the straps, the coverage ratio, the reduction factors, and the measured Tmax, the minimum factor of safety on the long-term geosynthetic strength was 6.5 for Period 1 and 6.6 for Period 2 and Period 3. That is, the minimum actual (i.e., measured) Fs is about four times larger than needed in design.
However, note that designer followed the common practice of using the default design value of φ=34o rather than the actual φ=50o. Consistent with AASHTO calibration in Figure 1 combined with φ=50o, this renders [Ka(φ=34o)/Ka(φ=50o)=0.283/0.133=] 2.14 times larger Kr and, hence, Tmax, than needed. Even if the designer had used the AASHTO allowable soil strength upper limit of φ=40o, the outcome would have been 1.63 times larger Tmax than needed. Subsequently, the factor of safety corrected for using reduced soil strength is about twice as calculated. Additional contributor to reduced load in the reinforcement is toe restraint which is ignored in design. Combining the underutilized soil strength in design (as required by AASHTO) and substantial toe restraint could reduce the load in the reinforcement by a factor of 4, close to the excess in actual factor of safety.
Concluding remarks
MSE walls of significant importance were constructed in conjunction with a complex and busy interchange on I-95. The walls were comprised on large concrete facing combined with polyester straps. Such walls have not yet been categorized by AASHTO as extensible or inextensible, rendering their design not fully defined. Consequently, a wall section was instrumented to ascertain the necessary design assumptions. The measured data indicates that the wall can be categorized as extensible using Kr/Ka=1.0 at any depth.
While AASHTO’s limitation on design value of φ to 40° is sensible, it penalizes the use of high-quality, well-compacted backfill. That is, using AASHTO’s normalized Kr/Ka while being restricted by φ≤40° may require the use of inflated reinforcement strength; it could be 1.5 to 2.0 stronger than needed.
Acknowledgments
DelDOT required the wall producer to instrument a section of the wall to monitor its performance as related to the design assumptions. The author appreciates DelDOT’s progressive perspective and the subsequent funding needed for reduction and interpretation of data.
The author also thanks Officine Maccaferri S.p.a. for the technical assistance in installing and Web-monitoring of all instruments used in this study. It is an expensive and complex venture.
The wall was designed by Matthew C. Miller, P.E., TEG Engineering Michigan. The author recognizes Matt’s openness, flexibility, responsiveness, and good sense of engineering. Of course, there were many players in this research and the author was lucky to be part of this team.