 TEXTILES.ORG

Generally, using current design standards (e.g., any AASHTO edition), geosynthetic reinforced segmental retaining walls (SRW) have performed well. However, there exists scenarios that predispose such systems to poor performance, particularly inadequate reinforcement within the wall system and in the unreinforced backslope at its crest. When reinforcement spacing is large, say, every three courses of stacked blocks (approximately 0.6 m or 24 inches), such walls might deform beyond tolerance or lose facing units. These systems are commonly built with a backslope to reach a final design elevation economically; however, such backslopes are not reinforced and their gradient relative to the soil strength is quite steep (i.e., the backslope might be close to a state of shallow failure). Failure initiating within a backslope may affect upper blocks comprising the wall, requiring avoidable maintenance.
The stability of backslopes is particularly questionable during earthquake loading, where shaking may damage the upper portion of the wall by moving or dislodging the upper stacked blocks. This scenario is aggravated by a common reality in which an experienced wall contractor builds a wall first, followed by the site developer or contractor who constructs the broken backslope as well as much of the retained soil to very different standards. The involvement of multiple contractors may lead to inconsistent construction practices (e.g., compaction, use of select fill) for the wall and the soil behind and on top of the wall, leading to problems that could be avoidable with consistent and appropriate design.
Economically improving the performance
Two potential issues were stated in the introduction: large reinforcement spacing and a steep broken backslope. Improving wall performance for both aspects is, at face value, simple. That is, using closely spaced reinforcements and building taller reinforced walls would eliminate the need for broken backslopes. However, this may significantly affect the cost of the wall by simply using more reinforcement, requiring a larger amount of select backfill and increasing costs associated with time and labor. Less costly solutions could include:
Using closely spaced, short intermediate layers of reinforcement between primary reinforcement layers. An important side benefit of such a construction is facilitating satisfactory compaction behind the face, creating a coherent front end for the reinforced wall. Through this practice, the reinforced soil mass is augmented by short reinforcement at a flexible facing, contributing to both stability and performance of the wall.
Using weak geosynthetic reinforcements embedded within the broken backslope. In essence, the slope above the wall will become a low-cost reinforced slope that again facilitates good compaction of the fill comprising the backslope.
Note that in the U.S. there is no formal design methodology that considers the impact of intermediate short reinforcement on the internal stability. However, AASHTO 2020 recognizes the limit equilibrium methodology introduced by Leshchinsky et al. (2016) and its applicability to “complex” geosynthetic reinforced walls. Consequently, this methodology is utilized, as implemented in program ReSSA+, to demonstrate the design and impact of intermediate reinforcement as well as to assess the required reinforcement to render the upper slope adequately stable.
Instructive example problem
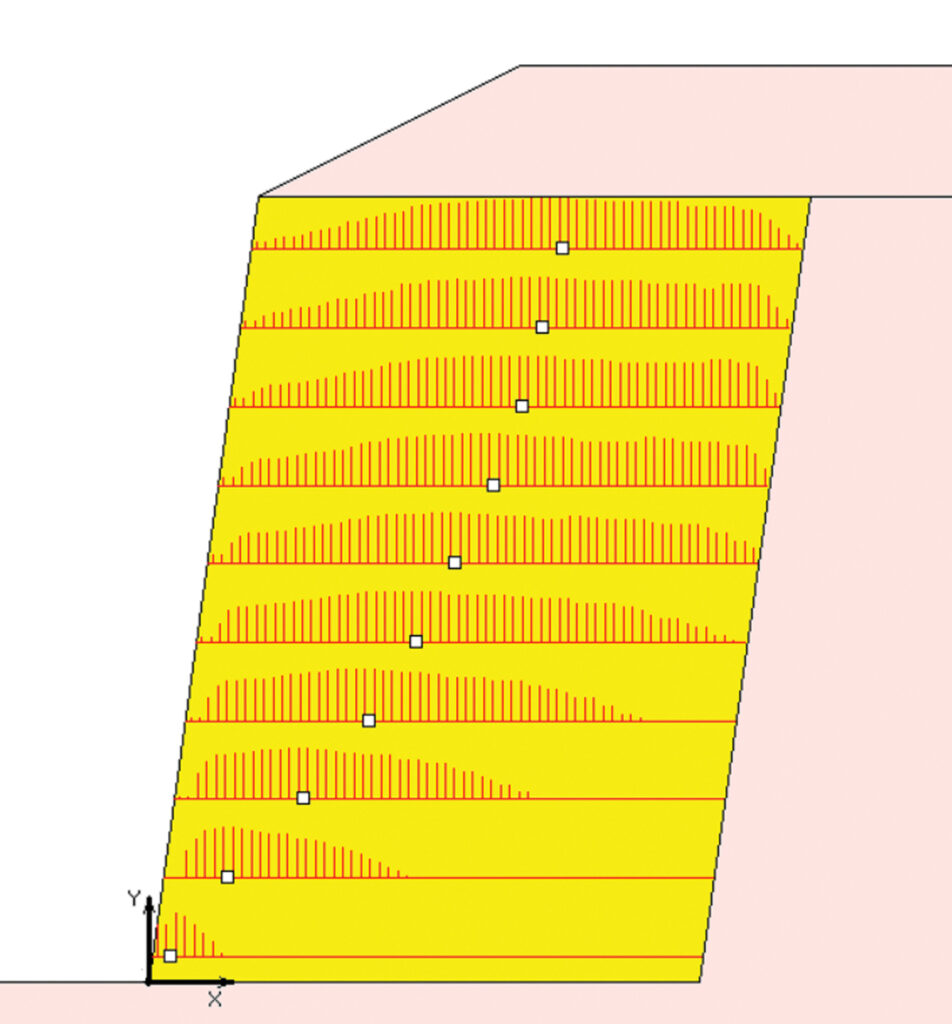
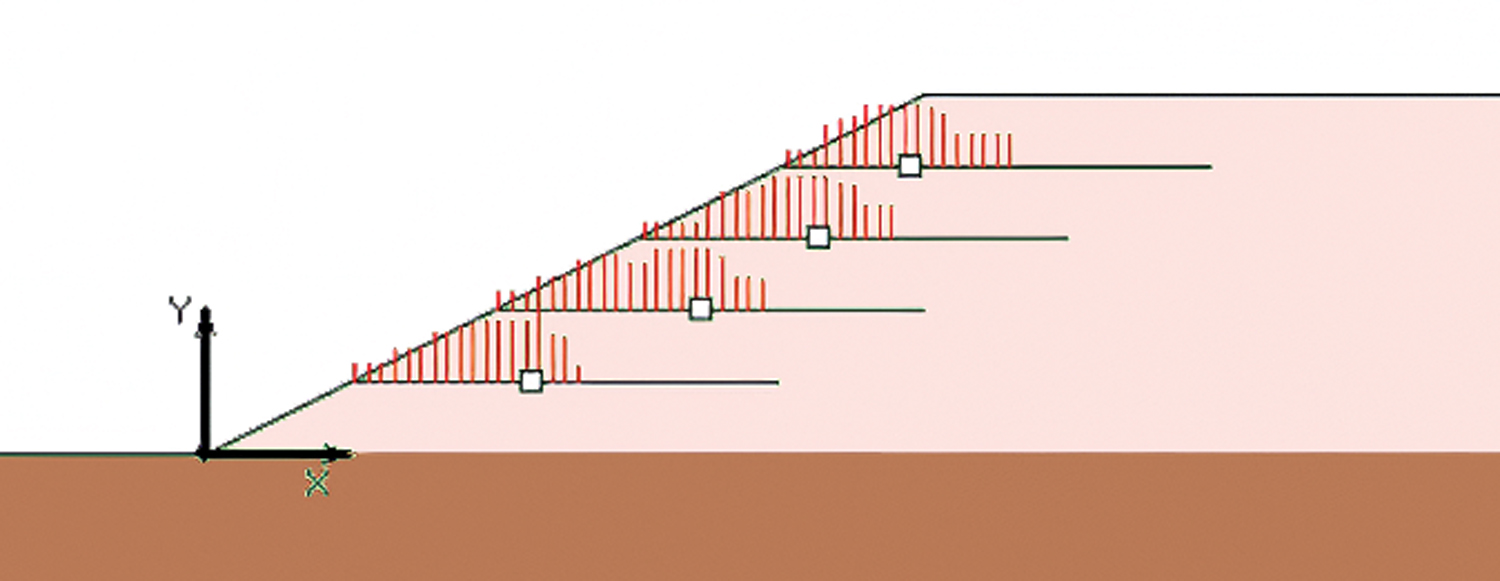
Demonstrating the two points of improvement is best done using an instructive example problem. Since all computations were done using Standard International (SI) units, the authors prefer to use these units followed with the approximate Imperial units in parenthesis. Consider the wall shown in Figure 2 where the following data is given:
The wall height is H=6 m (approximately 20 feet), batter is 8 degrees, backslope inclination is 1(v):2(h) (i.e., 26.6 degrees) and rise is 1 m (approximately 3.3 feet). The unit weight of reinforced and retained and top soils is 22 and 20 kN/m3, respectively. While cohesion is 0, the friction angle of the reinforced and retained and top soils is 34 and 30 degrees, respectively. Primary reinforcement spacing is 0.6 m (approximately 24 inches) (i.e., every three block courses). The length of reinforcement is taken as L=0.7H=4.2 m (approximately 14 feet).
With this given data we seek to find the force in the reinforcement along its length, T(x), needed for internal stability. This distribution of load depends on pullout resistance, layout of reinforcement, soils properties and problem configurations. Using the methodology in Leshchinsky et al. (2016), the maximum load in each layer, Tmax, as well as the load at the connection, To, are determined. Using Tmax and To, one can select reinforcement with proper long-term strength as well as ensure adequate connection strength.
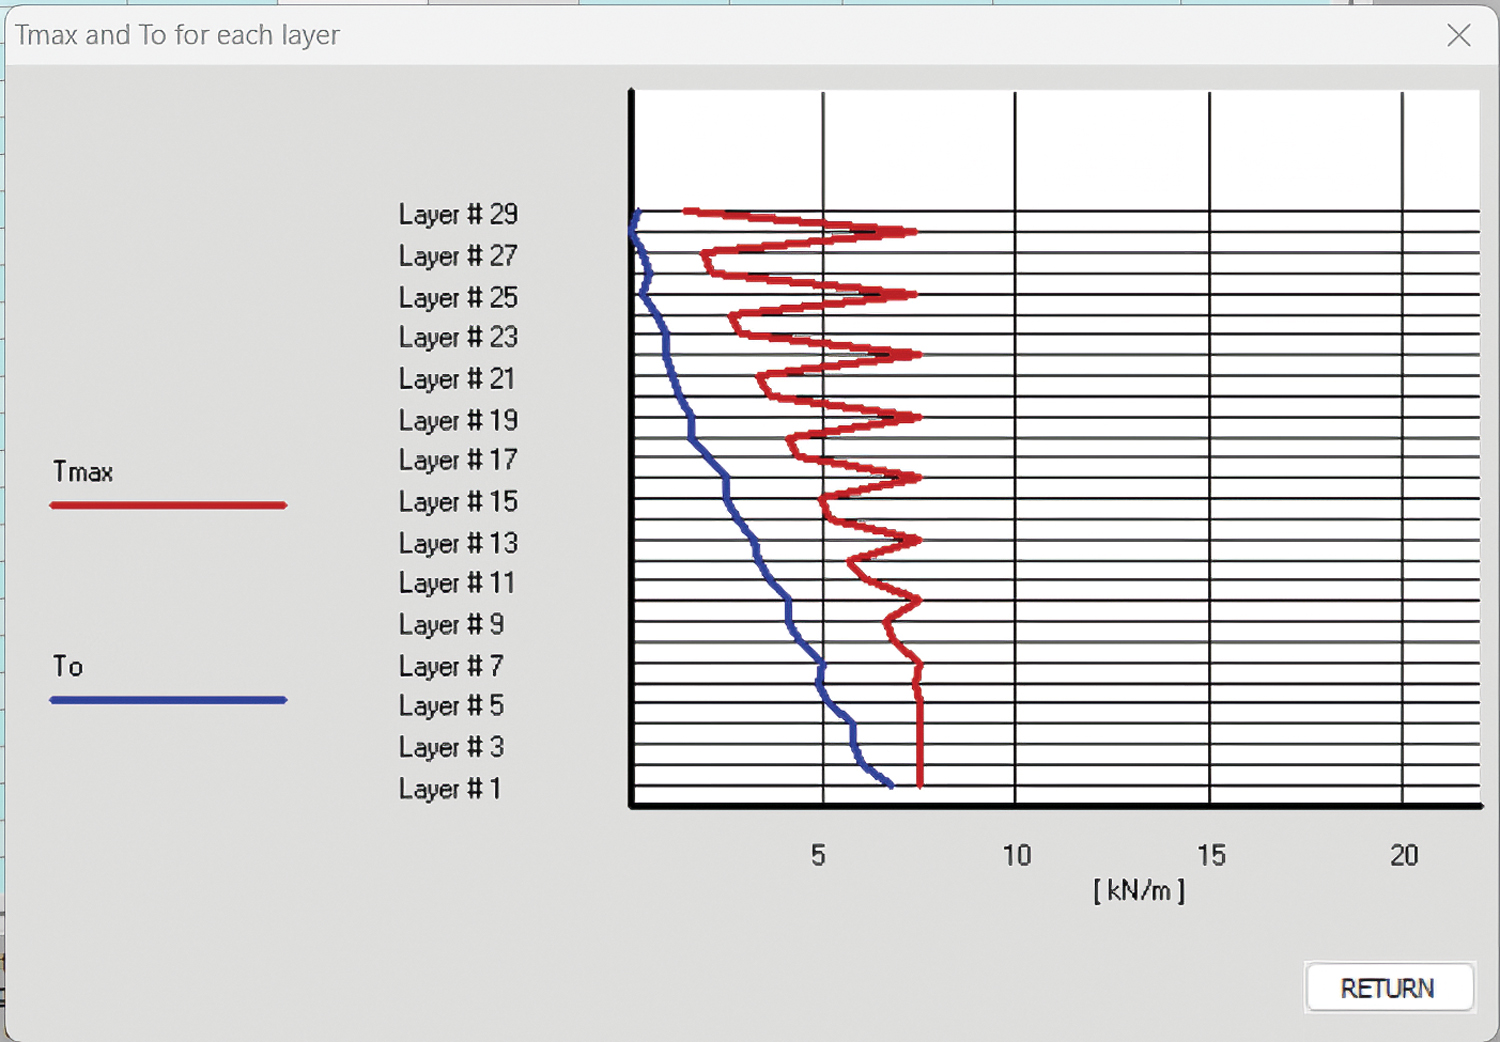
Figure 2 shows the computed distribution of load in the reinforcement, T(x). The max Tmax value is 12 kN/m (approx. 822 lb/ft). The white squares superimposed on the distributions depicted in Figure 2 indicate the location on each layer where the computed Tmax is acting. Note in upper layers that T(x) remains relatively high all the way back to where it exceeds the pullout resistance. Some of the top layers have two peaks of load. This is a result of potential slip surfaces extending through the retained soil. This phenomenon where Tmax is “pushed” to the rear is typical when broken backslope exists as well as when the retained soil has lower friction angles. While this observation is consistent with the mechanics of slope stability analysis, it is contrary to AASHTO’s assumption that Tmax lies strictly on a planar surface inclined at (45+ϕ/2) degrees where ϕ is the reinforced soil internal angle of friction, regardless of the backslope or retained soil. Furthermore, in internal stability, AASHTO takes the broken backslope as an equivalent uniform load acting on a horizontal crest. This is a false and unsafe equivalency as it supports the notion of a failure surface of (45+ϕ/2), suitable for horizontal crest but ignoring the possibility that top layers might be too short. Such a scenario could result in pullout of upper layers, typically materialized with outwards movement of upper-facing blocks.
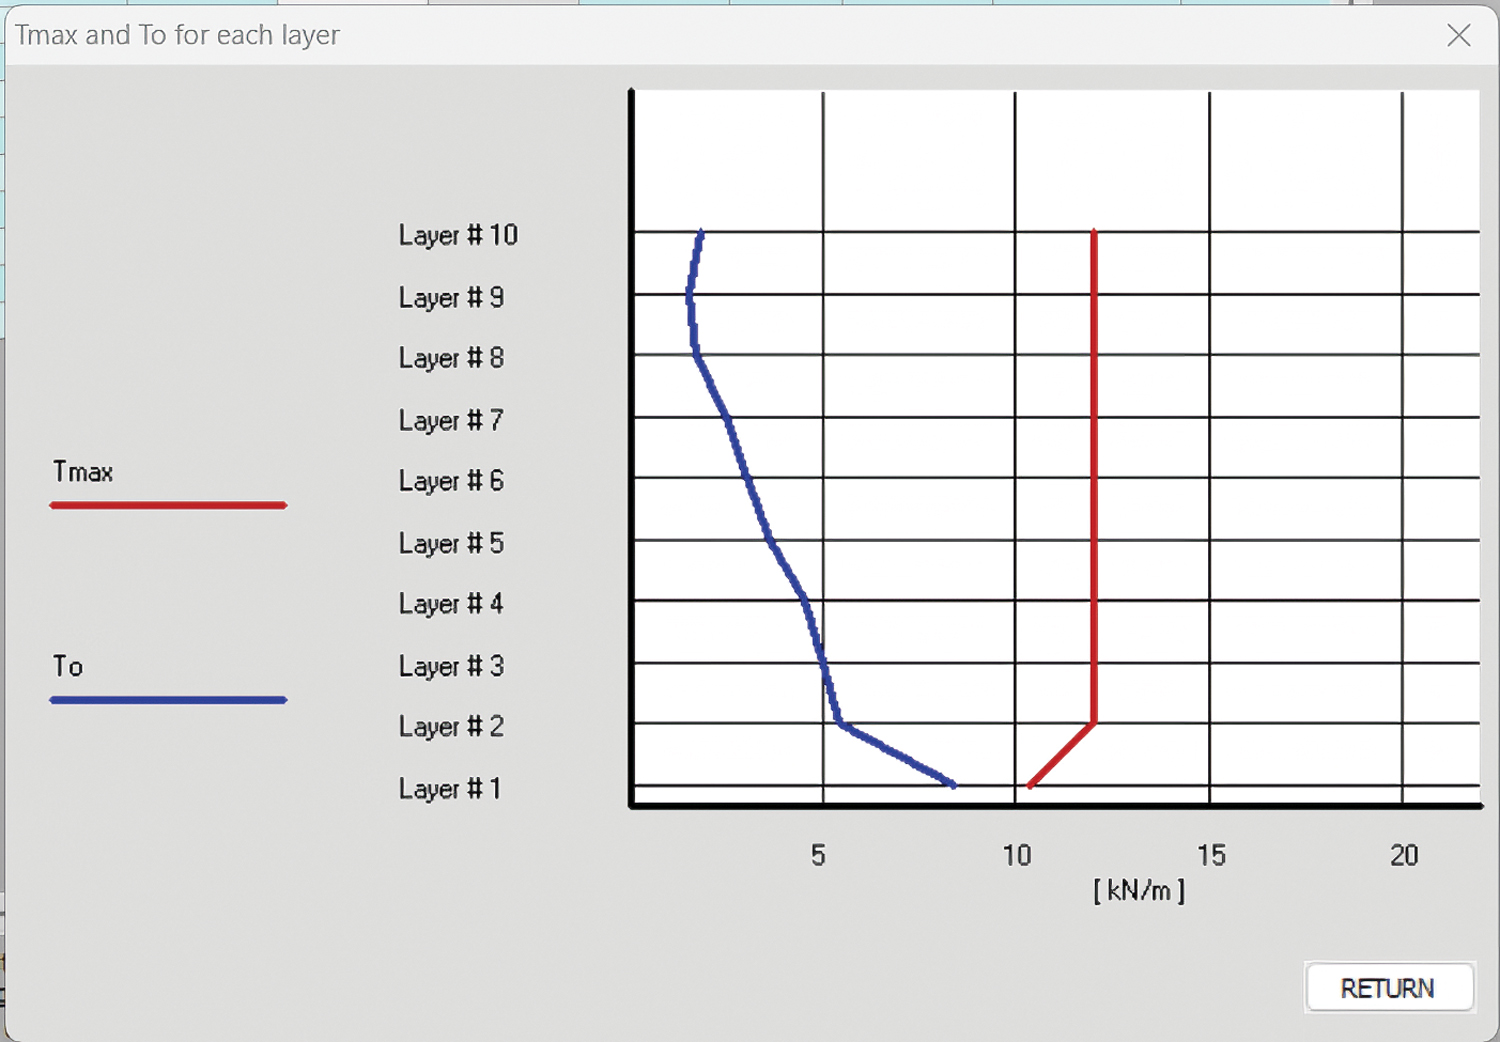
Figure 3 shows the distribution of Tmax and To among layers. In our example, maximum Tmax is approximately 12 kN/m(approximately 822 lb/ft) for all layers except for the bottom layer where it is slightly less. Knowledge of maximum Tmax enables the designer to rationally select reinforcement with adequate long-term strength. Note that the connection load, To, is relatively low compared with each respective Tmax and that for each layer, in AASHTO, the To value is assumed to equal Tmax. Only at the bottom layer, To=8.4 kN/m (approximately 576 lb/ft), is connection load, about 2/3 the corresponding Tmax. Consider that Tmax in the bottom layer is close to the facing, thus making sense that the connection will have to bear the rather large load, yet smaller than Tmax.
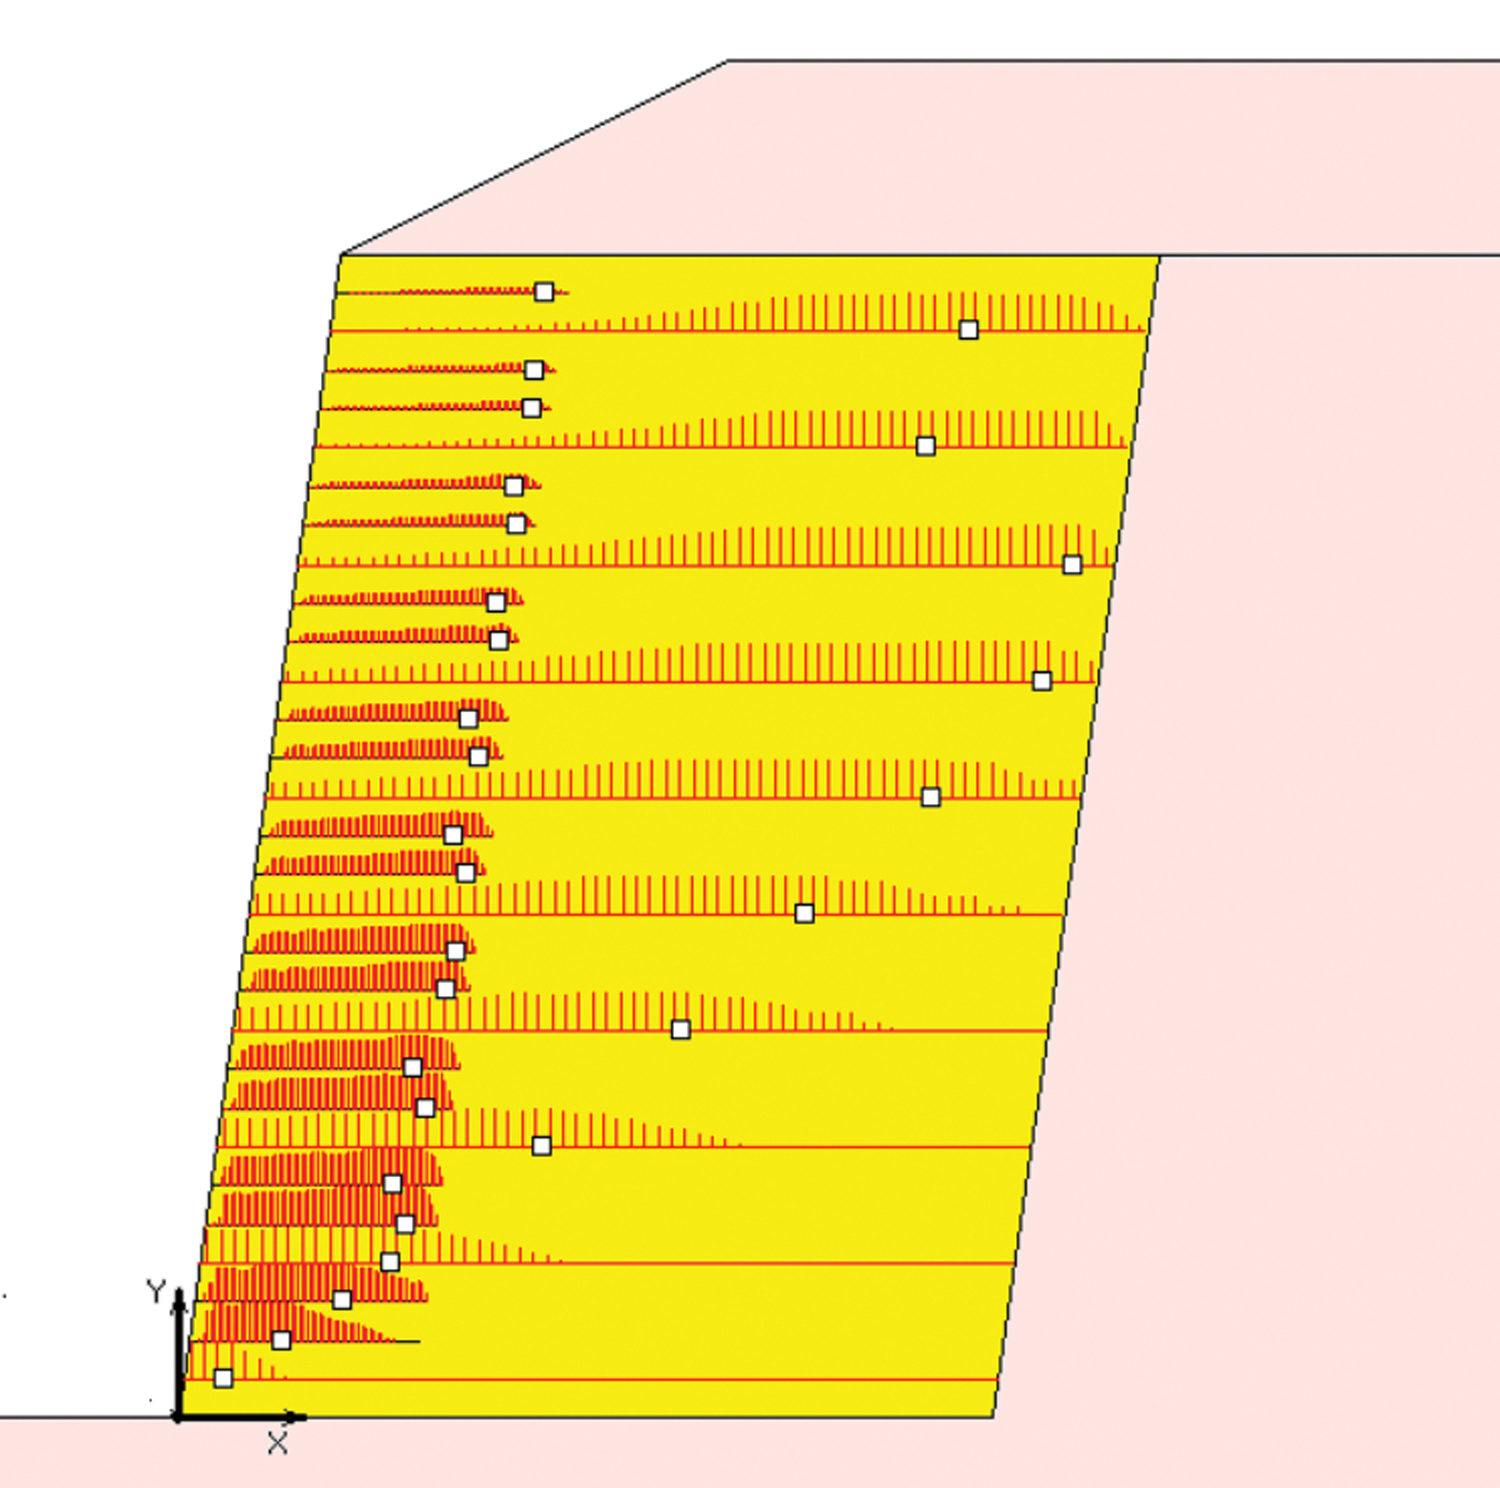
The impact of intermediate layers is seen in Figure 5. Compared with the baseline case, Figure 2, maximum(Tmax) is 7.5 kN/m (approximately 514 lb/ft), about 63% of the maximum value for the case of primary reinforcement only. The maximum To is 6.8 kN/m (approximately 466 lb/ft), about 80% of the primary reinforcement only. Many of the upper layers carry much smaller connection loads; these layers are under the immediate surcharge of the broken backslope. The added intermediate layers reduce both connection and reinforcement loads, allowing for use of weaker reinforcements or, more importantly, adding stability at the front end of the SRW analyzed.
So far, we have treated the broken backslope as a slope above the reinforced wall. However, its inclination 1:2 (26.6 degrees) is quite steep considering a friction angle of ϕ=30 degrees for the backfill soil. It can be shown that, under unreinforced conditions, such a condition renders a factor of safety of about 1.15. This is a marginal value in design of slopes even though failure might be of shallow or sloughing type. Requiring a global factor of safety of 1.5, common in design of slopes, and using the method by Leshchinsky et al. (2016), one gets the distribution shown in Figure 6. Note that to facilitate compaction, short layers spaced at 0.2 m (approximately 2 feet), each 1.2 m (approximately 4 feet) long, were used: the amount of added reinforcement in this case is small while the benefits could be significant. Looking at the distribution of T(x), the maximum Tmax is 0.31 kN/m (approximately 21 lb/ft), a very low value. That is, because formally this slope is stable (albeit marginally), the reinforcement is likely to be dormant but when needed, this low strength may play a significant role. Using weak reinforcements in stabilizing a slope above the wall, constructed by the site contractor, may improve the performance of the wall by serving as a safeguard against common imperfect construction and field conditions (e.g., transient flow of water) while facilitating compaction of a “secondary” element of the wall system.
The amount of geosynthetics needed for the baseline design is 420 m2 per meter length of wall (approximately 1380 ft2 per foot length of wall). The added area of secondary reinforcement is 22.8 m2 per meter length of wall (approximately 75 ft2 per foot length of wall). The added reinforcement in the backslope zone is 4.8 m2 per meter length of wall (approximately 16 ft2 per foot length of wall). If one implements the facing and backslope improvements, a total of 27.6 m2 per meter length (approximately 90 ft2 per foot length) of extra geosynthetic is needed; i.e., about 6.5% more reinforcement compared with the baseline design. Installing these additional geosynthetic materials also means a minor increase in construction costs. However, cost of failure is difficult to estimate before it actually happens; i.e., it is difficult to assess potential savings resulting from improved wall performance. Generally, based on the authors’ experience, failure cost is high, much more than the cost of extra reinforcement to prevent such failure. It should be noted that the rational use of intermediate or secondary layers allows for relatively large spacing of primary layers (in our case, every three courses of stacked blocks) as well as use of slightly weaker reinforcement. Consequently, without speculative consideration of savings from avoiding failure, it is believed that the added net cost of intermediate layers material to the overall cost of project is small, perhaps in the order of 1% to 2%. The alternative solution of using closely spaced reinforcement is excellent, as it has been performing well; however, it requires more reinforcement than the case with secondary reinforcement.
Conclusions
It is demonstrated that using intermediate reinforcement layers may alleviate connection loads as well as reduce loads carried by primary reinforcements. This may be important when a slope is constructed over the wall resulting in improved wall performance. Also, it is shown that very weak and short reinforcement may enhance the stability of such a slope, thus reducing likelihood of such slope failure, which may damage the upper portion of the SRW facing. A rational and robust design approach is used to render the required values of reinforcement and connection loads.
References
Leshchinsky, D., Leshchinsky, O., Zelenko, B., and Horne, J., “Limit equilibrium design framework for MSE structures with extensible reinforcement,” FHWA-HIF-17-004, Contract DTFH6114D00047-5010, October 2016. https://www.fhwa.dot.gov/engineering/geotech/pubs/hif17004.pdf.
Dov and Ora Leshchinsky founded ADAMA Engineering, Inc. in 1989. Dov has over 47 years of experience in geotechnical engineering, for 32 years has served as a professor of geotechnical engineering at the University of Delaware, and is a Professor Emeritus in the department of civil and environmental engineering. Ora is an emerita registered professional engineer (PE) in the state of Delaware and has over 50 years of experience as a practicing engineer and as a university instructor of basic courses in engineering.
Ben Leshchinsky, Ph.D., P.E. is the Richardson Chair and Professor at Oregon State University. He is currently the president of IGS-North America.
All figures courtesy of ADAMA Engineering.