 TEXTILES.ORG

By Benjamin Mahaffay, Jeremy Robinson, Jeffrey Gagnon and Gregory Norwood
In recent years, there has been an increasing interest to improve pavement structures through mechanical stabilization by incorporating geosynthetic products within the structure. The Geosynthetic Materials Association (GMA) has identified eight categories of commercially available geosynthetics: geotextiles, geogrids, geonets, geocomposites, geosynthetic interlayers, geocells, erosion control materials and geomembranes. These materials serve multiple functions, including separation, filtration, drainage, reinforcement/stabilization, cushion/protection, confinement, stress relief, erosion protection and moisture barrier (Berg et al. 2000). Geotextiles and geogrids are the two most commonly used categories of geosynthetics for the purpose of reinforcement/stabilization. There have been numerous studies supporting the benefits of reinforcement/stabilization with the use of geotextiles and geogrids within a pavement structure attributed to the three mechanisms of (1) lateral restraint, (2) increased bearing capacity and (3) tensile membrane support. These primarily benefit the pavement structure by extending pavement life, reducing structural thickness or increasing rutting resistance. Studies document the benefits of how geosynthetic products can be an efficient way to improve the strength properties of materials used in pavement structures (Abu-Farsakh et al. 2016, Holtz et al. 1998, Perkins et al. 2005, Zornberg 2011). However, the majority of the studies focus on thinner highway pavement structures simulating vehicular traffic loading. Therefore, the U.S. Army Engineer and Research Development Center (ERDC), in collaboration with the Federal Aviation Administration (FAA), performed a laboratory cyclic plate load test study to collect data and verify the benefit of geosynthetic products on thicker airport pavement under simulated aircraft loading (Figure 1).
The FAA recently issued draft Advisory Circular 150/5370-10H, Standards for Specifying Construction of Airports, which includes language regarding geotextiles and geogrids. In a parallel effort, ERDC is conducting medium-scale laboratory research to quantify the potential structural and performance improvements that geosynthetics products provide within an airport pavement structure. The results of this study will provide much-needed data examining geosynthetics in airport pavement structures under aircraft loading. A proposed follow-up study will further examine geosynthetic performance under full-scale accelerated pavement testing at the National Airport Pavement Test Facility (NAPTF) during Construction Cycle 09 (CC9) planned for 2019.
Objective and test layout
The technical objective of the cyclic plate load experiment was to perform cyclic plate load testing to compare performance of geosynthetic-reinforced airport pavement structures to non-geosynthetic-reinforced airport pavement structures under simulated aircraft loading. Pavement performance was measured in terms of traffic benefit ratio (TBR) through comparison of the reinforced to the non-reinforced pavement as defined by American Association of State Highway and Transportation Officials (AASHTO) R50-09. Instrumentation was placed at several locations within the pavement to obtain pavement deflections, stress and strain response parameters. The quantity of sensors and specific locations are described later in the instrumentation layout.
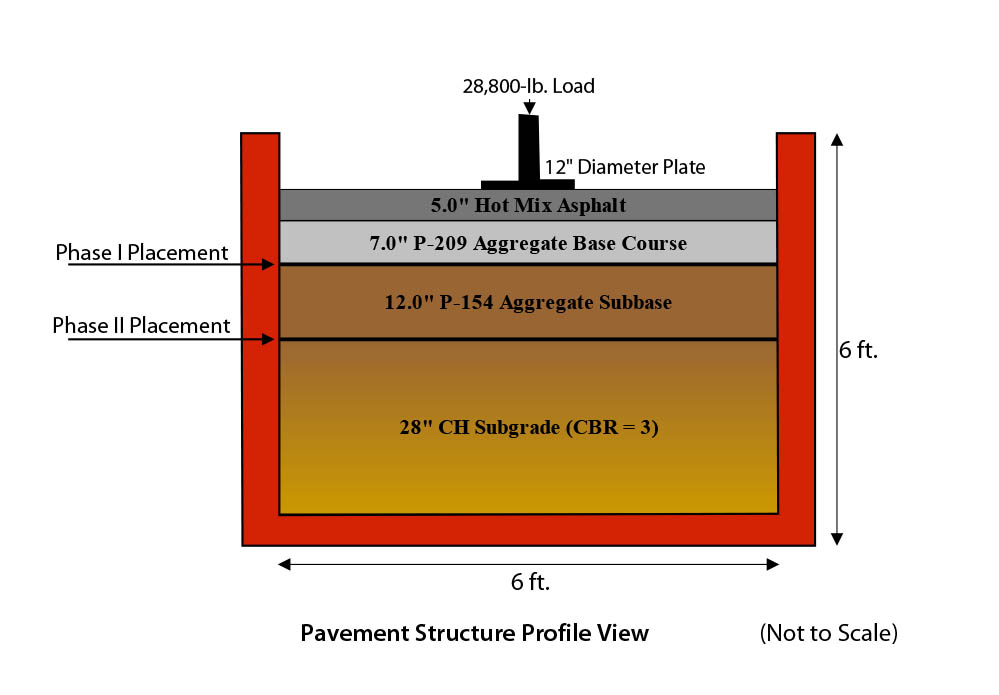
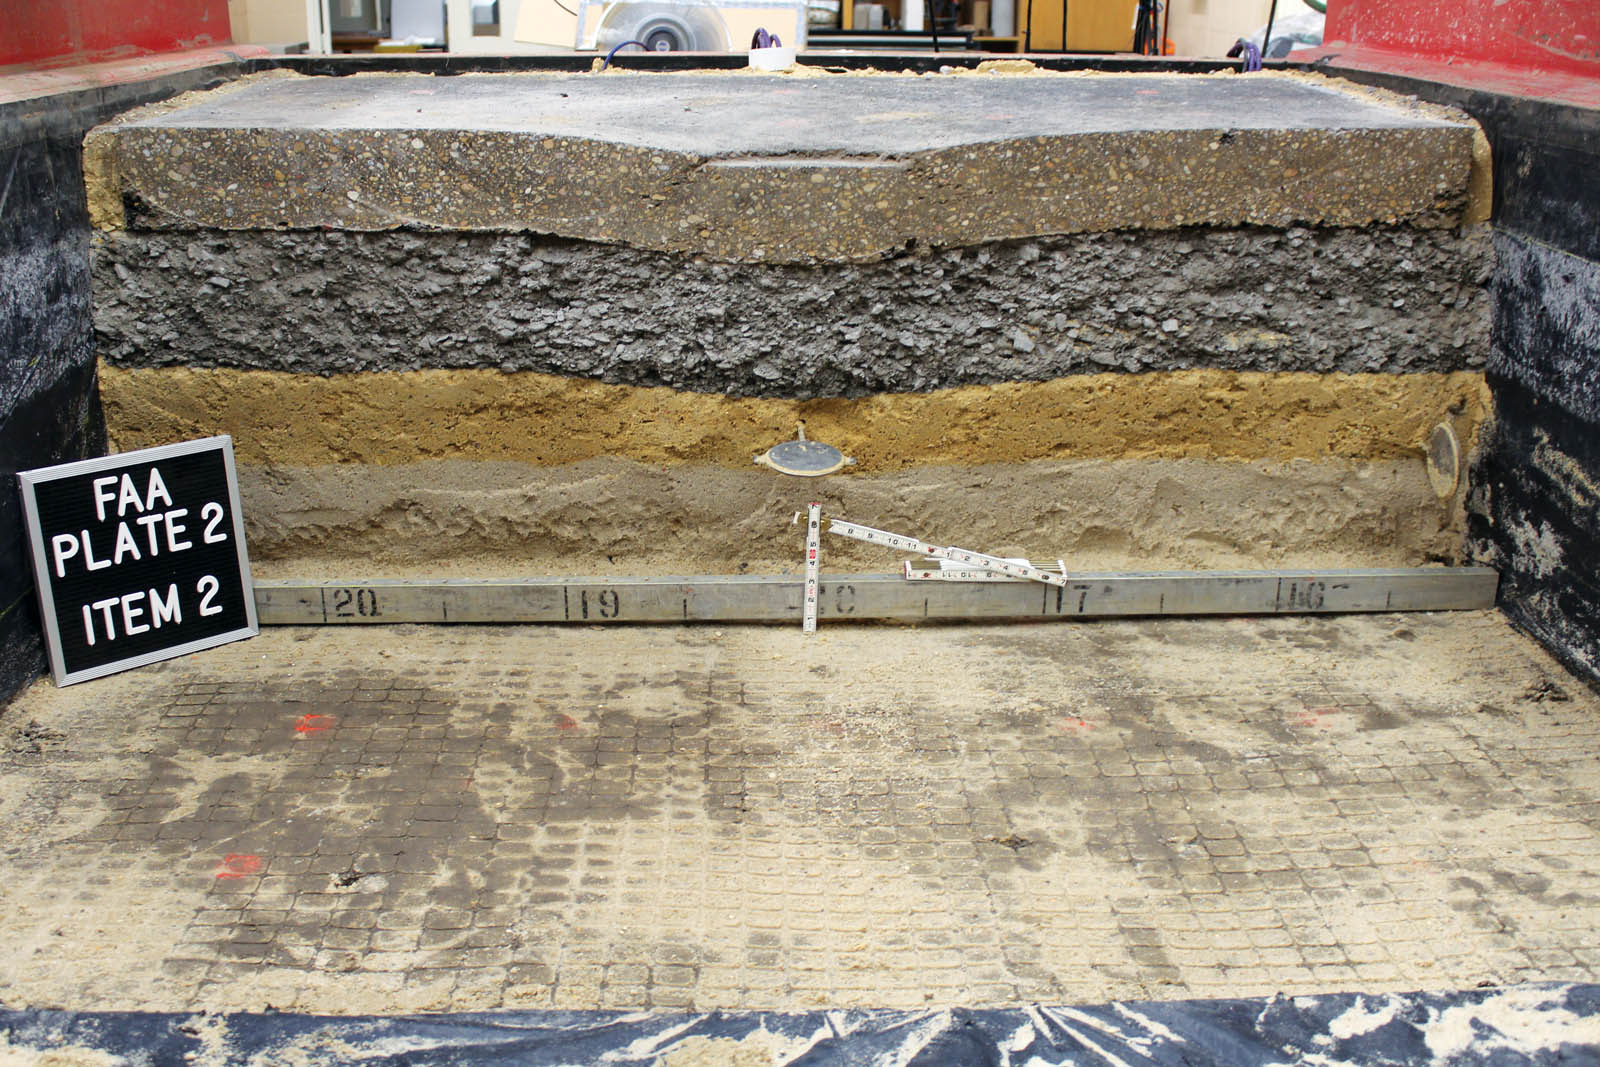
Representative flexible airport pavement structures were constructed within a 6 × 6 × 6 foot (1.8 × 1.8 × 1.8 m) steel test box to a design depth of 52 inches (132 cm) and consisted of 5 inches (12.7 cm) of hot-mix asphalt (HMA) surface layer, 7 inches (17.8 cm) of P-209 crushed aggregate base course, 12 inches (30.5 cm) of P-154 subbase and more than 28 inches (71.1 cm) of subgrade, as shown in Figure 2. Cyclic plate loading was performed using a 50,000-pound (222.4-kN) Gilmore hydraulic actuator controlled with an MTS System Corporation control system. A 28,800-pound (128-kN) load was applied to pavement through a 12-inch (30.5-cm) diameter plate to achieve a 254.6 psi (1,755 kPa) load, simulating a common aircraft loading condition. Each load pulse was applied for a total duration of 1.2 seconds. The sinusoidal load was applied for 0.3 seconds followed by a 0.9-second rest period. Loading was applied to each pavement test item until failure, defined as 1 inch (2.5 cm) and 2 inches (5.1 cm) permanent surface deformation.
A total of 10 test items were completed through two phases. Phase I, completed in 2016, included four test items incorporating various geosynthetic products at the base course/subbase interface, while Phase II, completed in 2018, included six test items incorporating various geosynthetic products at the subbase/subgrade interface.
Pavement material placement and properties
The subgrade material was constructed using a locally available clay, known as Vicksburg buckshot clay. The clay soil liquid limit, plastic limit and plastic index were 90, 28 and 62 respectively, which classifies as a high-plasticity clay (CH) per the Unified Soil Classification System (USCS). Modified Proctor test per American Society for Testing and Materials (ASTM) D1557, Method C for Phase I and Phase II, yielded a maximum dry density of 101.4 pcf (1,624.3 kg/m3) and 102.4 pcf (1,640.3 kg/m3) at a target optimum moisture of 19.8% and 22.8%, respectively. The material was placed and compacted at a target moisture of 38% to achieve a desired California Bearing Ratio (CBR) of 3.0%.
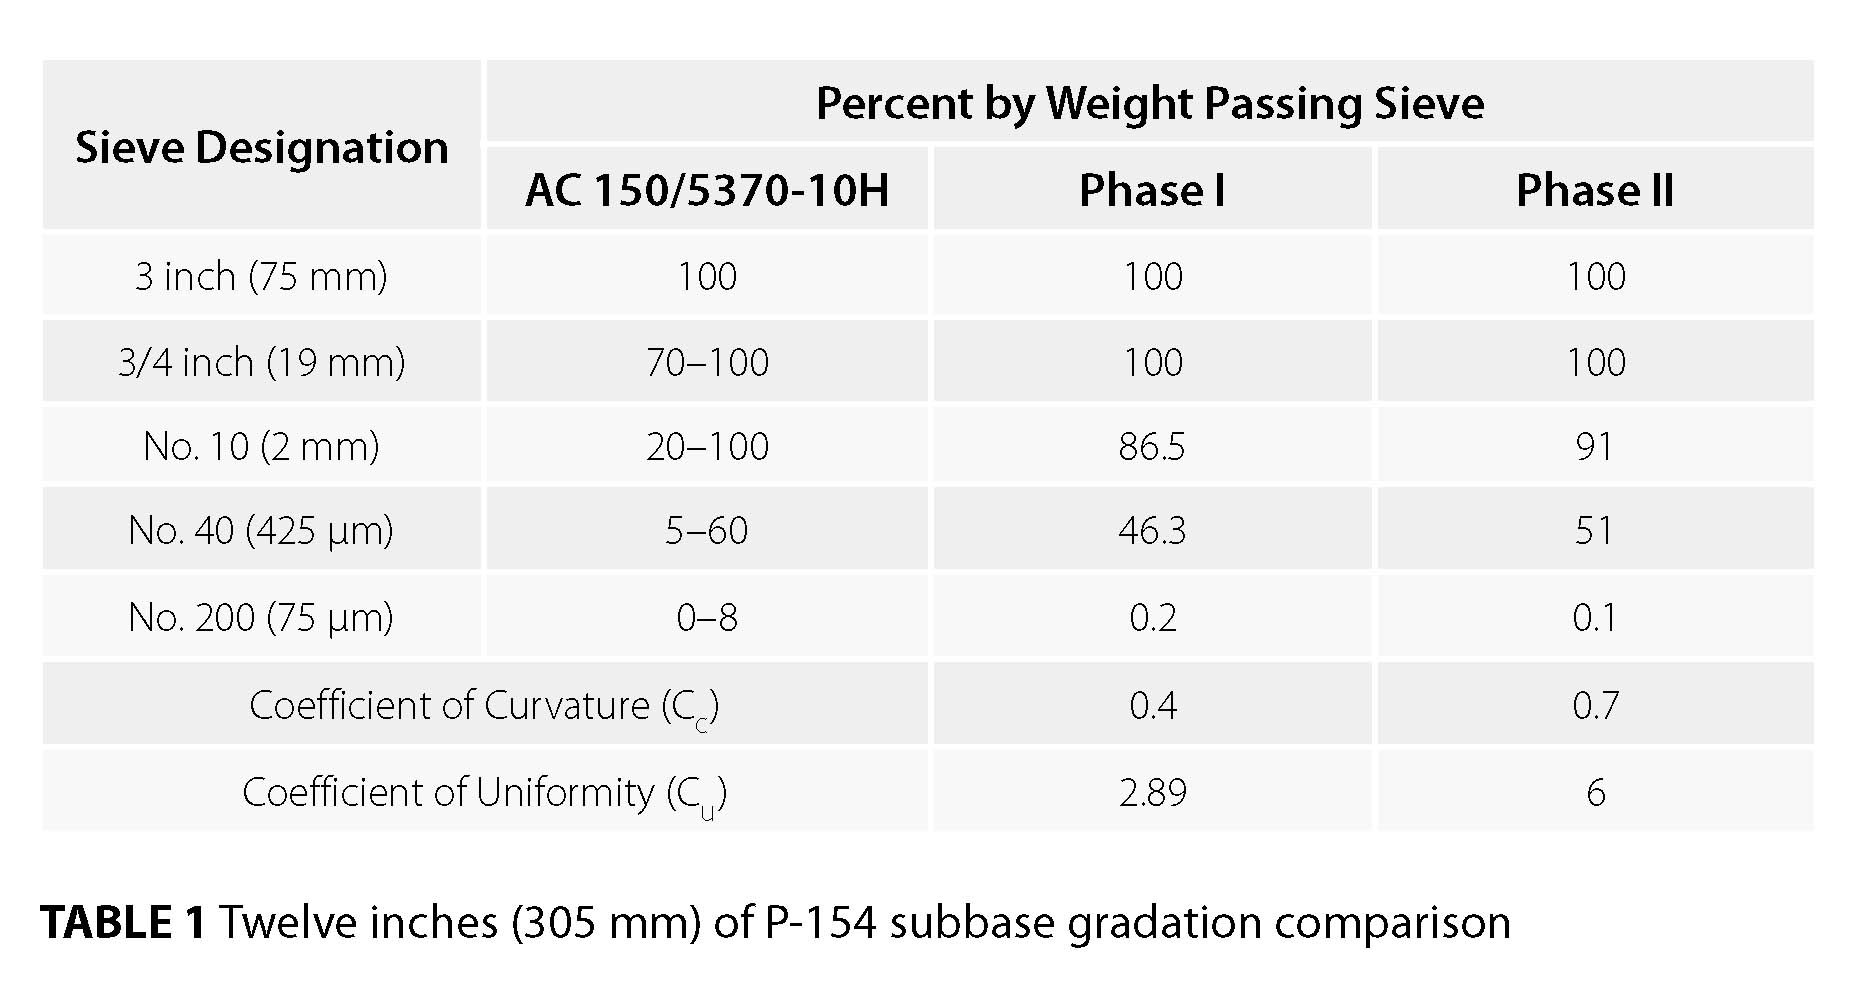
Subbase material was constructed using a locally available granular material meeting the gradation requirements of P-154 per draft FAA Advisory Circular 150/5370-10H, as shown in Table 1. Per ASTM D2487, the Phase I and Phase II granular subbase materials were classified as poorly graded sand (SP) and well-graded sand (SW), respectively.

Aggregate base course material was constructed using locally available material known as 610 crushed limestone, closely representing the gradation requirements of P-209 per draft FAA Advisory Circular 150/5370-10H, as shown in Table 2. Per ASTM D2487, the Phase I and Phase II aggregate base materials were classified as a poorly graded gravel with silt and sand (GP-GM) and well-graded gravel with silt and sand (GW-GM) per USCS respectively. Modified Proctor compaction tests were performed in accordance with ASTM D1557, Method C. A summary of Phase I and Phase II aggregate base test results are shown in Table 2.

The HMA pavement surface course was constructed using a locally available 0.5-inch (12.7-mm) nominal maximum aggregate size (NMAS) mixture, using a PG 67-22 asphalt binder content of approximately 5.3%. A comparison of the mix design and the FAA P-401 per Advisory Circular 150/5370-10H is shown in Table 3. For constructability purposes and to reduce variability, the asphalt was placed and compacted outdoors in a 12 × 100-foot (3.7 × 30.5-m) test strip and subsequently cut to size and placed in the box.

ERDC performed a quality control test during the construction of each of the 10 test items to minimize construction variability and ensure target values were achieved. The as-constructed, preloaded material properties are presented in Table 4.
Geosynthetic material properties
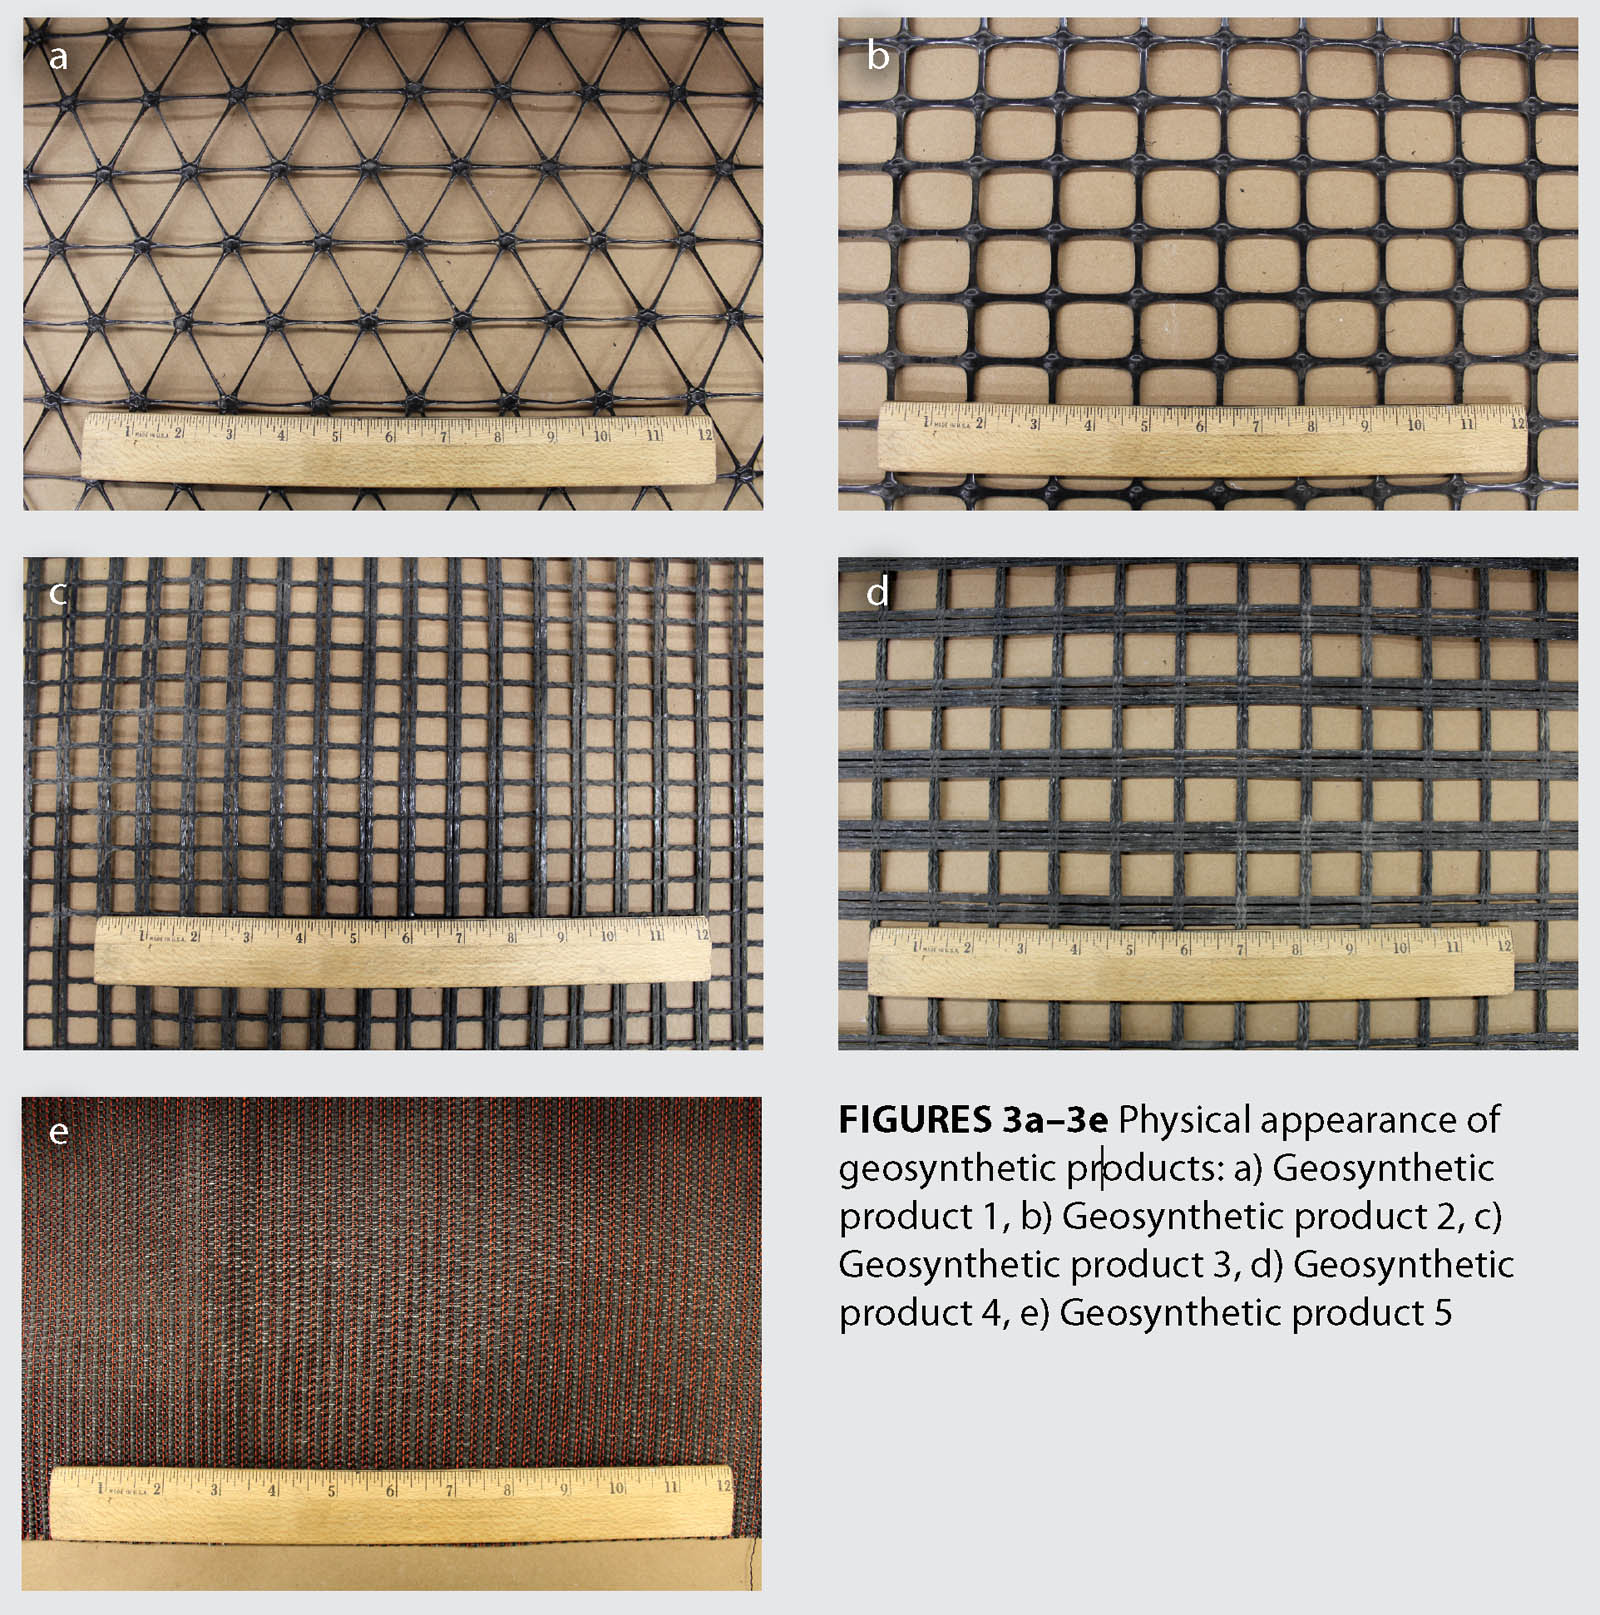
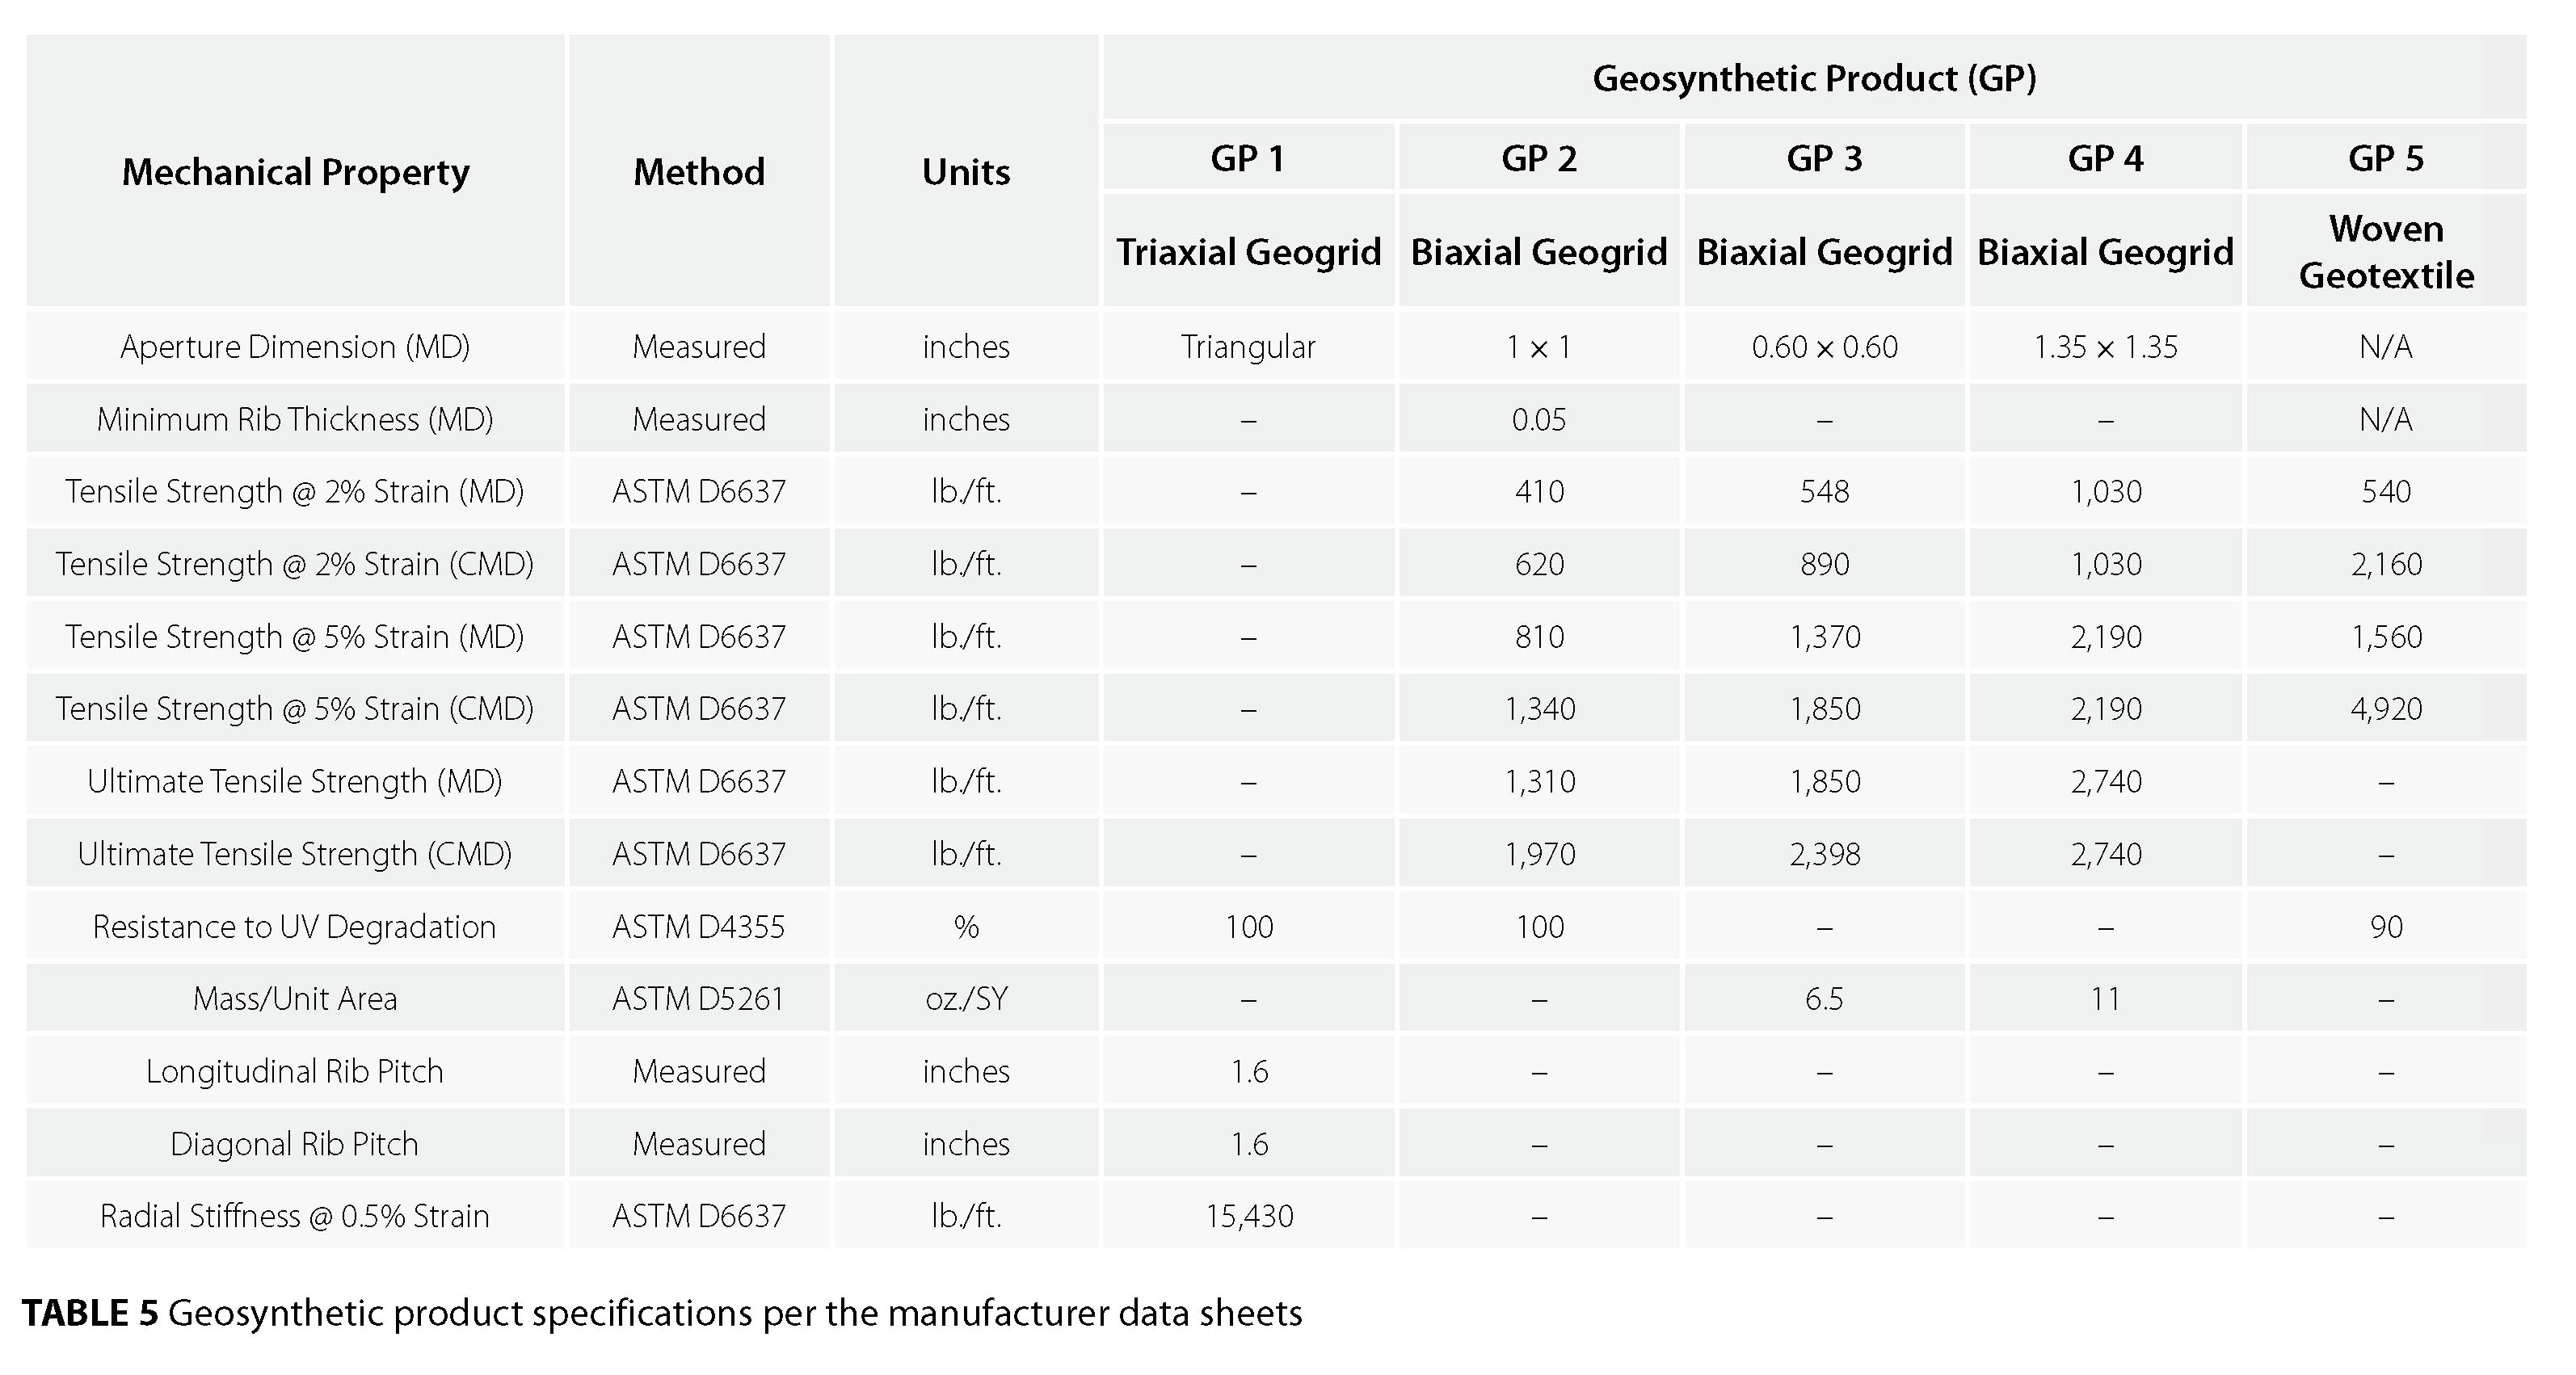
A total of five geosynthetic products (GP) were selected, as shown in Figures 3a–3e, consisting of four geogrids and one geotextile, to serve the function of reinforcement/stabilization within the pavement structure. The geogrid products consisted of GP 1, a punched polypropylene sheet oriented in multiple, equilateral directions to form triangular apertures; GP 2, a punched polypropylene sheet oriented in longitudinal and transverse direction to form biaxial rectangular apertures; GP 3 and GP 4, both made up of polypropylene yarns manufactured in an interlocking longitudinal and transverse direction to form biaxial rectangular apertures; and GP 5, a geosynthetic comprised of polypropylene filaments formed into an innovative weave. Specific mechanical properties published by the manufacturer of each geosynthetic product are shown in Table 5.
Instrumentation layout
Pressure cells, linear variable displacement transducers (LVDTs) and pore pressure transducers were installed throughout the pavement structure to monitor surface deformation and quantify the response of each pavement structure during cyclic loading. A series of six LVDTs were placed transversely along the centerline of the 12-inch (30.5-cm) load plate to measure permanent surface deformation on the HMA surface layer. One pressure cell was installed 1 inch (2.5 cm) below the subbase surface. One pressure cell was installed 1 inch (2.5 cm) below the subgrade surface, and one pressure cell was installed 2 inches (5.1 cm) above the bottom of the subgrade. The pressure cell used in the Phase I and Phase II study were 9 inches (22.9 cm) diameter and 4 inches (10.2 cm) diameter, respectively. The pressure cells were reduced in size to limit the area of influence considering the overall size of the experiment. One pore pressure transducer was installed 1 inch (2.5 cm) below the subgrade surface. Figure 4 shows a cross section schematic of the instrumentation plan.

Results
Cyclic plate load tests were conducted on 10 representative flexible airport pavement test items under a 254.6 psi (1,755 kPa) simulated aircraft load. Five different geosynthetic products placed at two distinct locations were compared to unreinforced control test items. Pavement surface deformation was monitored using a series of six LVDTs, while maximum pressure was monitored at various pavement depths using a series of three pressure cells for each test item. The pavement response data for each of the 10 test items were compared to the control test item of its respective phase. This is due to the significant difference in performance of Phase I and Phase II control test items, which may be attributed to noticeable differences in the as-constructed material properties of the HMA layer between the two phases, as shown in Table 4.

Tables 6 and 7 and Figure 5 are used to evaluate pavement behavior and quantify performance. Permanent surface deformation data collected directly from the LVDTs is also shown in Figure 5. Total number of cycles to achieve failure at 1 inch (2.5 cm) and 2 inches (5.1 cm) of surface deformation and TBR values are shown in Table 6.
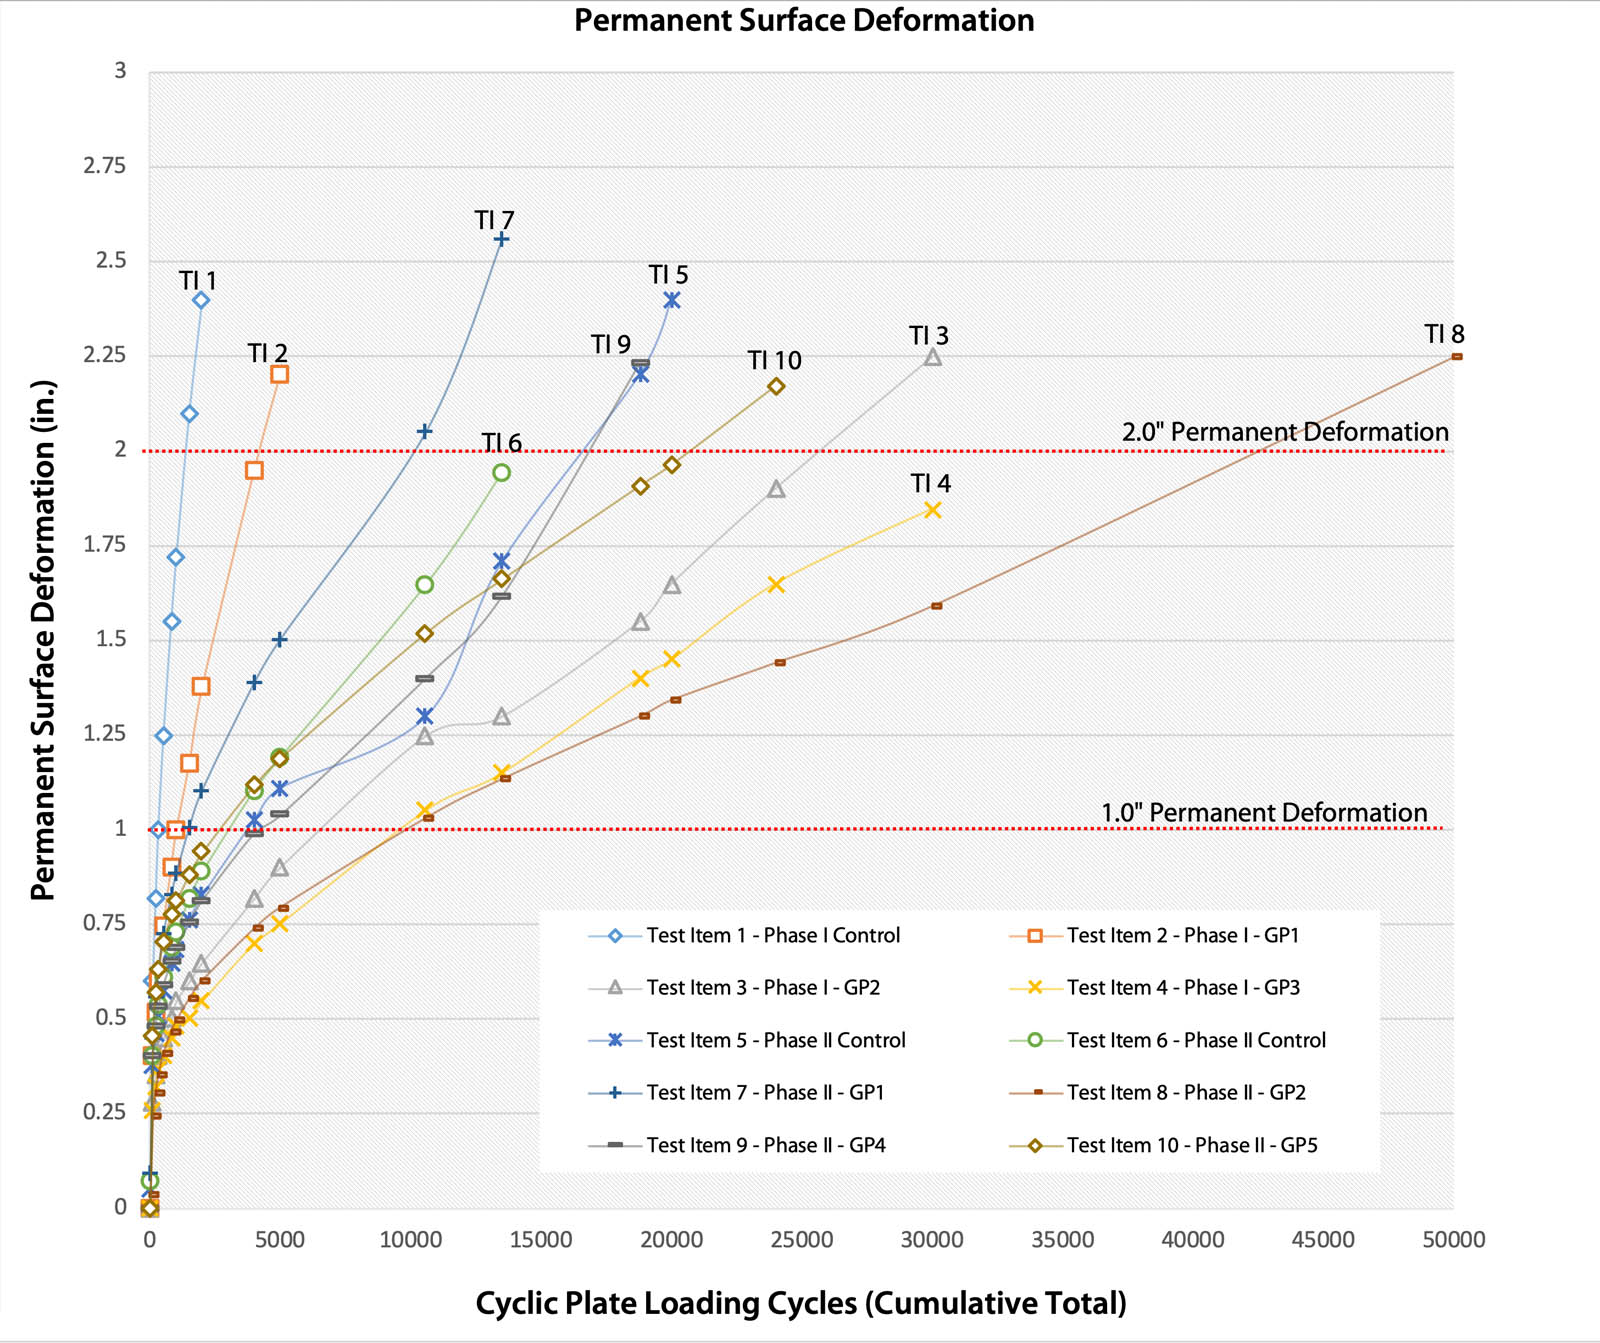
The Phase I results shown in Figure 5 show a promising trend that a geogrid placed at the base course/subbase interface can significantly improve rutting performance. This is reiterated by the calculated TBR values ranging from 3.3 to 29.7 at the 1-inch (2.5-cm) and 2-inch (5.1-cm) failure criteria. The lower TBR values reported for Test Item 2 may be attributed to the reduced P-209 base course thickness of 1 inch (2.5 cm), as shown in Table 4 on page 27. However, literature has shown that geosynthetics may provide a reduced layer thickness benefit, while maintaining improved structural performance.
The Phase II results shown in Figure 5 show less consistent performance benefit when placed deeper in the pavement structure at the subbase/subgrade interface. The Phase II TBR values, ranging from 0.4 to 2.6, show a reduced performance benefit when compared to the results of Phase I. This suggests that geosynthetics placed deeper in the pavement structure reduce the realized benefit. It was identified that TBR values of Test Item 7 and 10 exhibited an increase in TBR at the 2-inch (5.1-cm) compared to the 1-inch (2.5-cm) deformation criteria. This suggests that increased loading and deformation may be required to engage the geosynthetic product and achieve a realized benefit when placed deeper in the pavement structure. Therefore, placement of geosynthetic product closer to the structural surface loading may be desirable to achieve the maximum benefits prior to significant deformation.
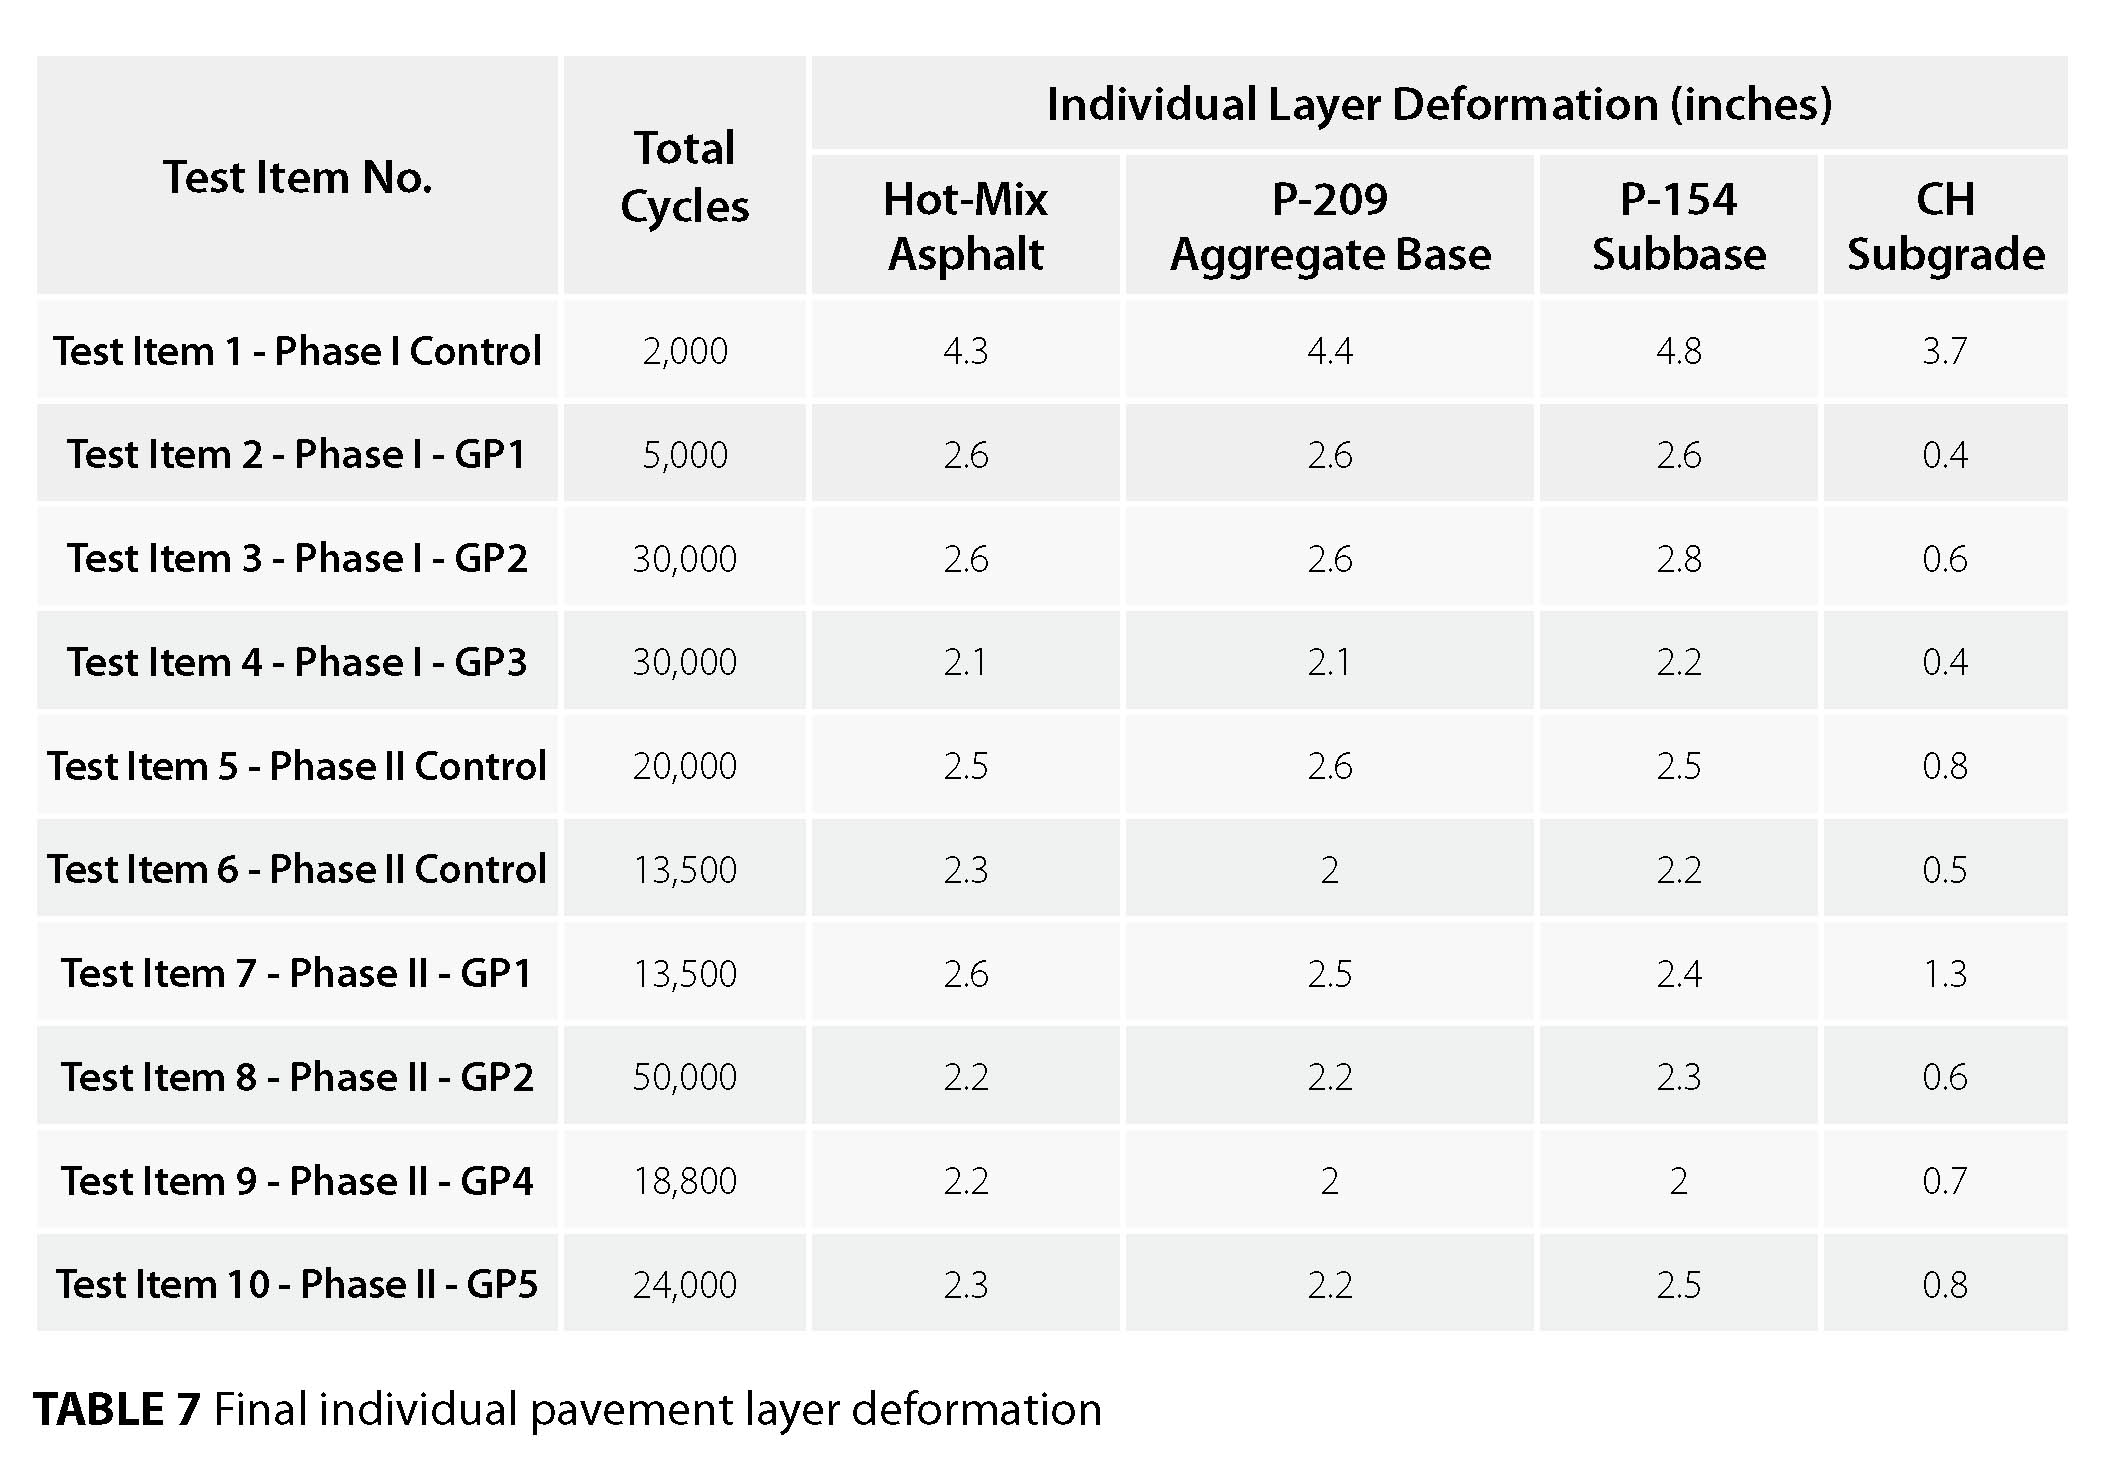
The total cycles applied and the post-loading pavement layer deformations data are shown in Table 7. The Phase I results show the geosynthetic-reinforced test items provided an overall structural benefit by reducing individual layer deformation at increased loading cycles. However, the Phase II individual layer deformation data was less consistent, showing a lesser benefit.
Conclusions and recommendations
Medium-scale cyclic plate load tests were performed on 10 representative airport pavement structure test items under simulated aircraft loading conditions. Five geosynthetic products were tested at two distinct locations. Analyses of the results yielded the following conclusions:
Incorporating geosynthetic products within thicker airport pavement structures provides a performance benefit through rut resistance properties, as identified in the TBR Phase I values greater than 1.
Incorporating geosynthetic products within airport pavement structures can provide improved performance while reducing base course thickness, as shown in Phase I Test Item 2.
Geosynthetic products placed at the subbase/subgrade interface in relatively thicker airport pavements provide less performance benefit compared to geosynthetics placed at the base course/subbase interface. Geosynthetic products placed deeper in thicker airport pavement structure require increased loading and deformation to achieve a realized benefit, which may be less desirable on airport pavements.
In conclusion, this research demonstrates geogrids and geotextiles properly designed and selected for the function of reinforcement/stabilization within flexible airport pavements can provide an improved pavement performance benefit. However, there seems to be a consensus among existing literature and industry professionals that quantifying these pavement performance benefits attributed by a specific geosynthetic product at a given location remains a challenge. Therefore, it is recommended that the FAA continue to incorporate various geosynthetic products in future research and construction cycles to further investigate the pavement performance benefits.
Acknowledgments
The work described in this article was funded by the Federal Aviation Administration (FAA) Airport Technology Research and Development Branch and performed at the U.S. Army Engineering Research and Development Center (ERDC). The authors would like to acknowledge support of the ERDC staff for test item construction and
data collection.
Disclaimer
The contents of this article reflect the views of the authors, who are responsible for the facts and accuracy of the data presented within. The contents do not necessarily reflect the official views and policies of the FAA or U.S. Army Corps of Engineers. The article does not constitute a standard, specification or regulation.
References
Abu-Farsakh, M., Hanandeh, S., Mohammand, L., and Chen, Q. (2016). “Performance of geosynthetic reinforced/stabilized paved roads built over soft soil under cyclic plate load.” Geotextiles and Geomembranes, 44(6), 845–853.
Berg, R. R., Christopher, B. R., and Perkins, S. (2000). “Geosynthetic reinforcement of the aggregate base/subbase courses of pavement structures.” AASHTO Committee 4E, June.
FAA Airport Technology Research and Development Branch Home Page. (2017). FAA William J. Hughes Technical Center, Atlantic City International Airport, N.J. https://www.airporttech.tc.faa.gov (July 25).
Holtz, R. D., Christopher, B. R., and Berg, R. R. (1998). “Geosynthetic design and construction guidelines.” U.S. Department of Transportation, Federal Highway Administration, Washington, D.C., FHWA-HI-98-038.
Norwood, G. J. (2016). “Cyclic plate testing of geogrid reinforced airport pavement,” FAA Draft Report DOT/FAA/AR-xx/xx (February).
Perkins, S. W., Howders, J. J., Christopher, B. R., and Berg, R. R. (2005). “Geosynthetic reinforcement for pavement system: US perspectives.” International Perspective on Soil Reinforcement.
Robinson, W. J., and Norwood, G. J. (2018). “Cyclic plate testing of geosynthetic reinforced airfield pavement–Phase II,” FAA Draft Report DOT/FF/AS-xx/xx (June).
Zornberg, J. G. (2011). “Geosynthetic-reinforced pavement systems.” Keynote Paper, Fifth European Geosynthetics Conference, EuroGeo5 (September).
Benjamin Mahaffay, P.E., PMP, is research civil engineer with the Federal Aviation Administration’s Airport Pavement R&D Section at the William J. Hughes Technical Center.
Jeremy Robinson, P.E., is research civil engineer at the U.S. Army Research
and Development Center.
Jeffrey Gagnon, P.E., is pavement R&D manager at the Federal Aviation Administration’s Airport Pavement R&D Section at the William J. Hughes Technical Center.
Gregory Norwood, P.E., is research civil engineer at the U.S. Army Research
and Development Center.
All photographs, illustrations and tables courtesy of the authors.