 TEXTILES.ORG

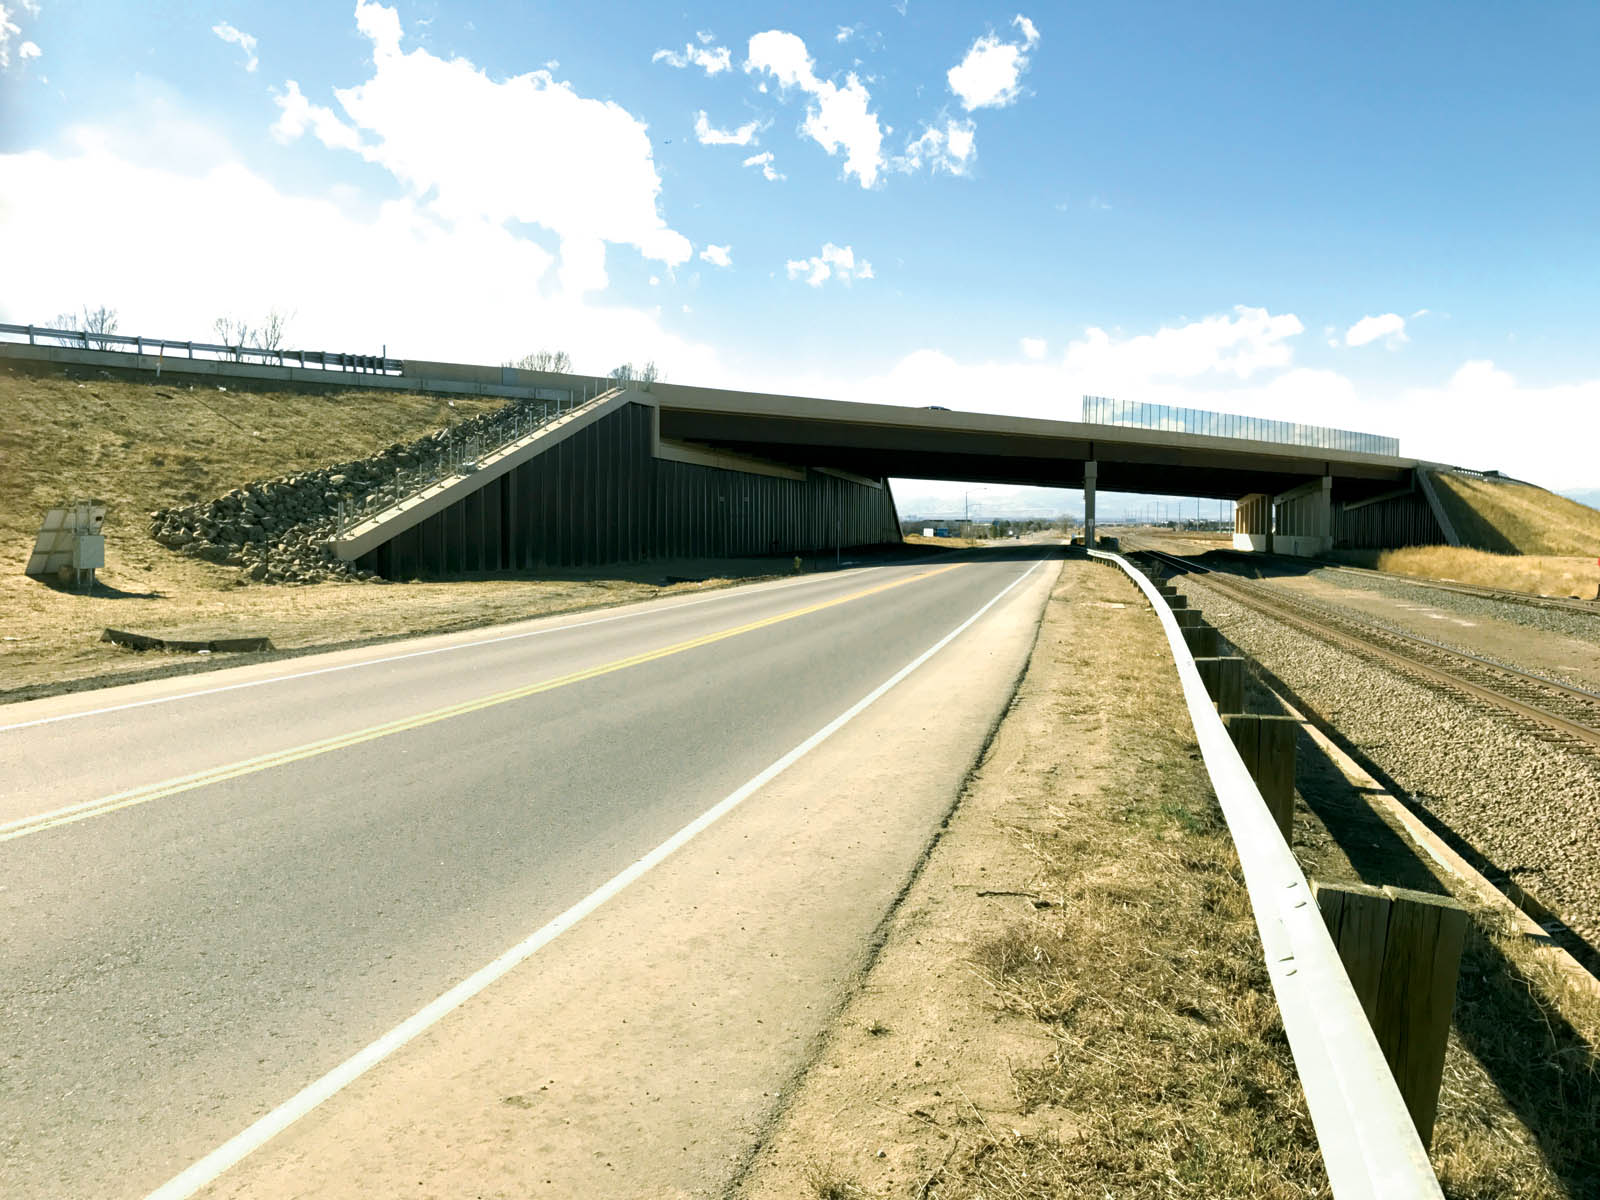
The I-70 multi-span bridges (Figure 1) over Smith Road in Aurora, Colo., included design methodology changes that were classified as “experimental features,” and, thus, additional project funds were included for evaluation. In order to understand the geostructural performance of the multi-span geosynthetic reinforced soil–integrated bridge system (GRS–IBS), the abutment was instrumented with a vertical chain of accelerometers, vertical and horizontal pressure cells, and geotextiles with embedded fiber optic strain sensors. All the data can be remotely accessed, combining traditional geotechnical monitoring strategies with cutting-edge fiber optic technology. Data was collected between July 2014 and June 2016, and analyzed to identify the importance of each monitoring element and to assess the performance of the GRS–IBS.
The project includes the construction of two multi-span bridges that convey I-70 over Smith Road and an active railroad line, replacing outdated and underperforming bridges. The new structures are founded on 12 × 84-inch (30 × 213-cm) H-piles at the northern abutment (Abutment 1), 36-inch (91-cm) diameter drilled shafts at Piers 2 and 3, and geosynthetic reinforced soil (GRS) at the southern abutment (Abutment 4). A driven sheet-pile facing with tieback anchor rods is used at each abutment.
This article focuses on instrumentation of the GRS–IBS at Abutment 4. At this abutment, the sheet-pile facing was driven prior to GRS construction. After driving the sheet pile, excavation was completed to a final bench elevation where deadman sheet piles were driven. Tie-rods were installed between the front-face sheet piles and the deadman sheet piles. GRS backfill was constructed in 4-inch (10-cm) lifts with woven geotextile reinforcement installed at 12-inch (30-cm) vertical spacing. Under the abutment footing, secondary reinforcement was placed every 4 inches (10 cm). The woven geotextile has a maximum tensile strength of 4,800 pounds-force/foot (70kN/m), and the cross-machine direction was laid perpendicular to the sheet-pile wall face. A cast-in-place concrete abutment seat was placed at the top of the GRS zone.
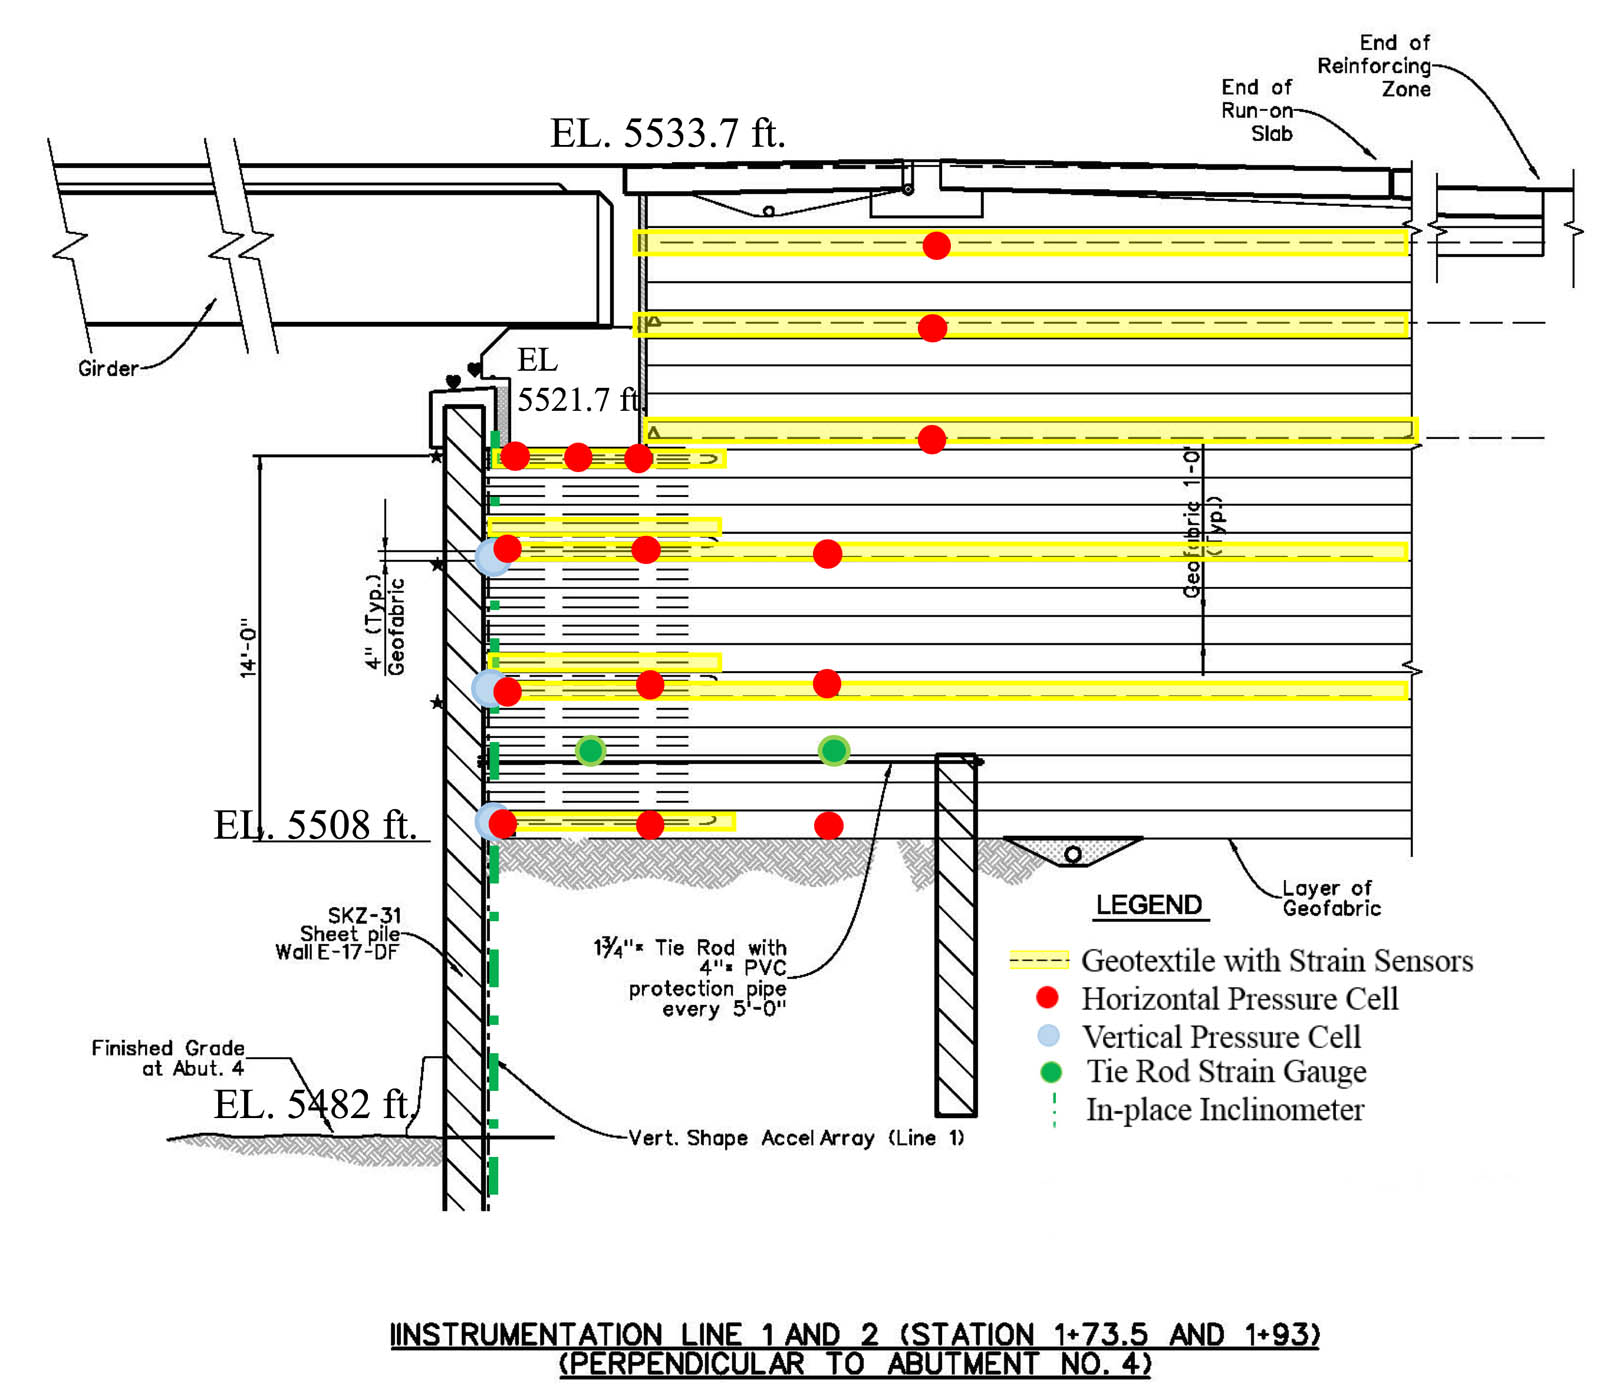
A comprehensive instrumentation program was implemented within the GRS zone of Abutment 4 and included several monitoring devices to assess deformations, internal strains and stresses. See Figure 2 for instrumentation layout. An in-place inclinometer system comprised of micromachined electromechanical system (MEMS) accelerometers was installed in a 3-inch (8-cm) diameter steel pipe welded to the back of the sheet pile. Geotextiles with embedded fiber optic strain sensors were installed at various reinforcement lifts. The geotextile sensor strips were installed in-between a sand layer and the woven reinforcement, with the sensor side facing upward. The sensors are fiber Bragg grating spaced at 3.28 feet (1 m) intervals along the geotextile. Vertical pressure cells were installed along the length of the reinforced zone and horizontal pressure cells were installed at several elevations behind the wall facing. The tie-rods between the sheet-pile face and deadman anchors were instrumented with strain gauges.
Abutment 4 construction details
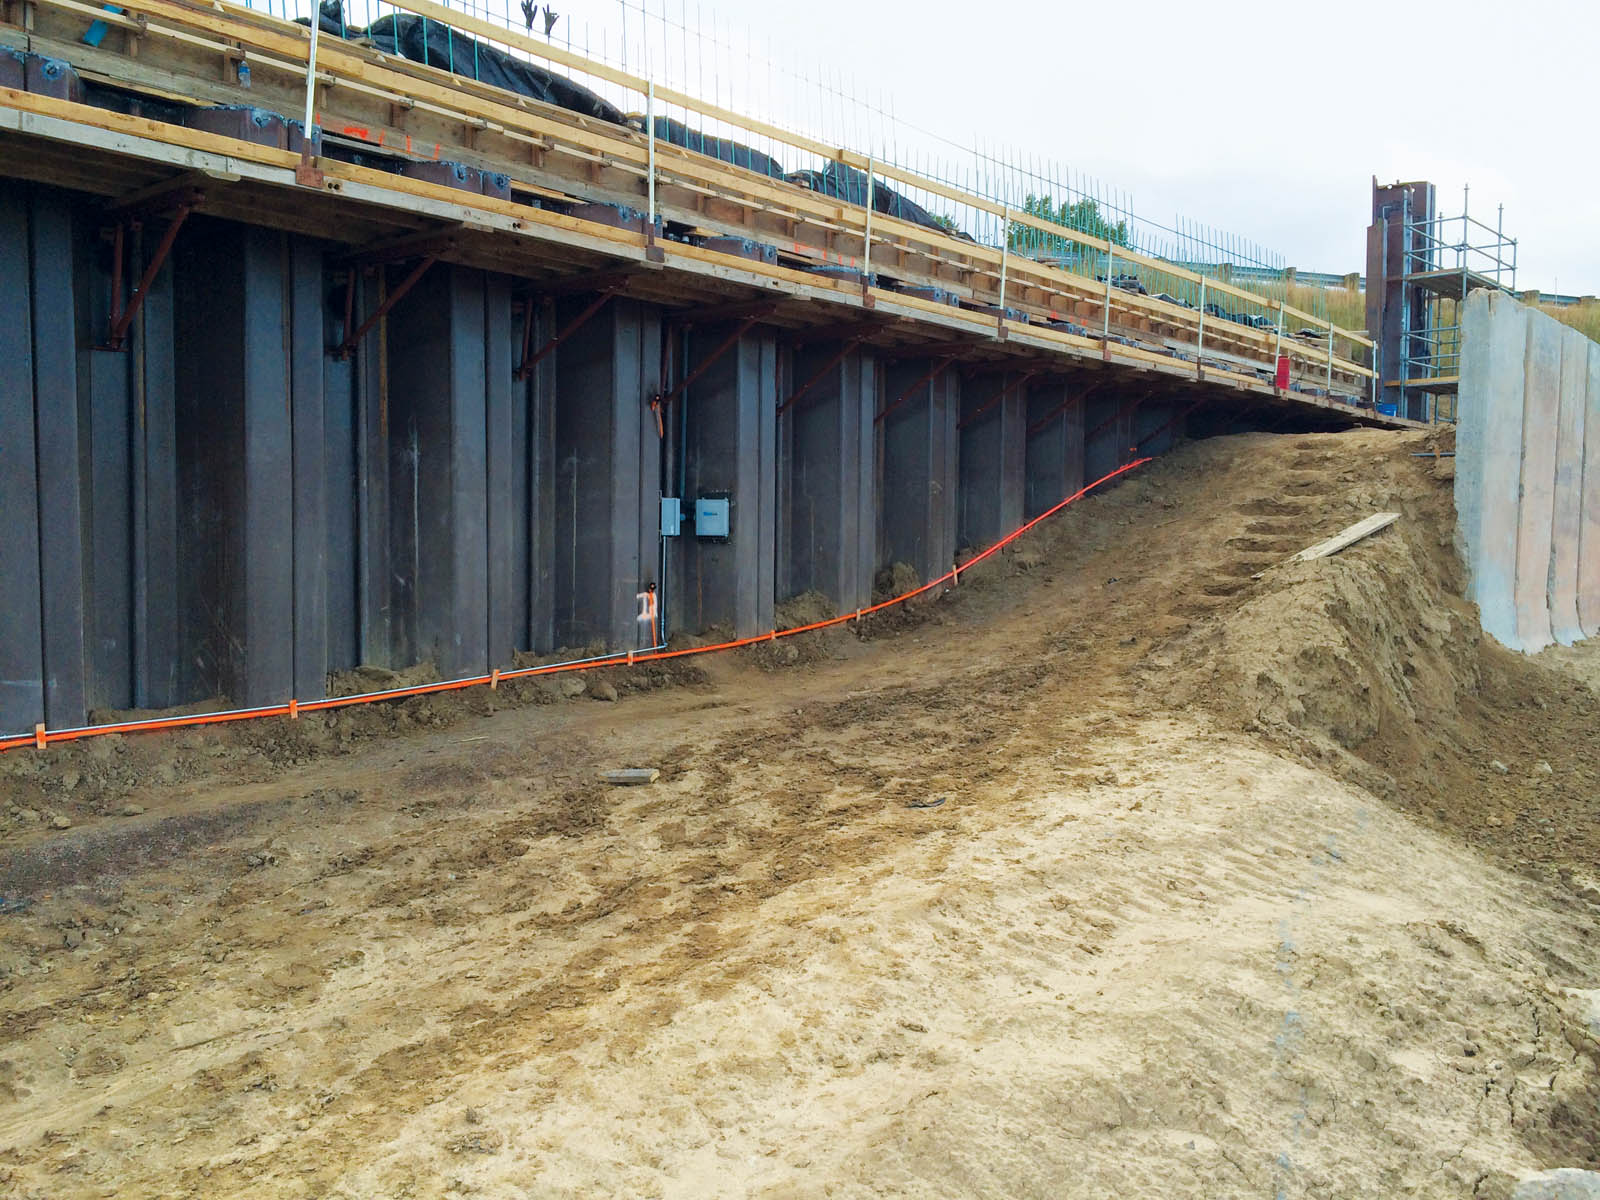
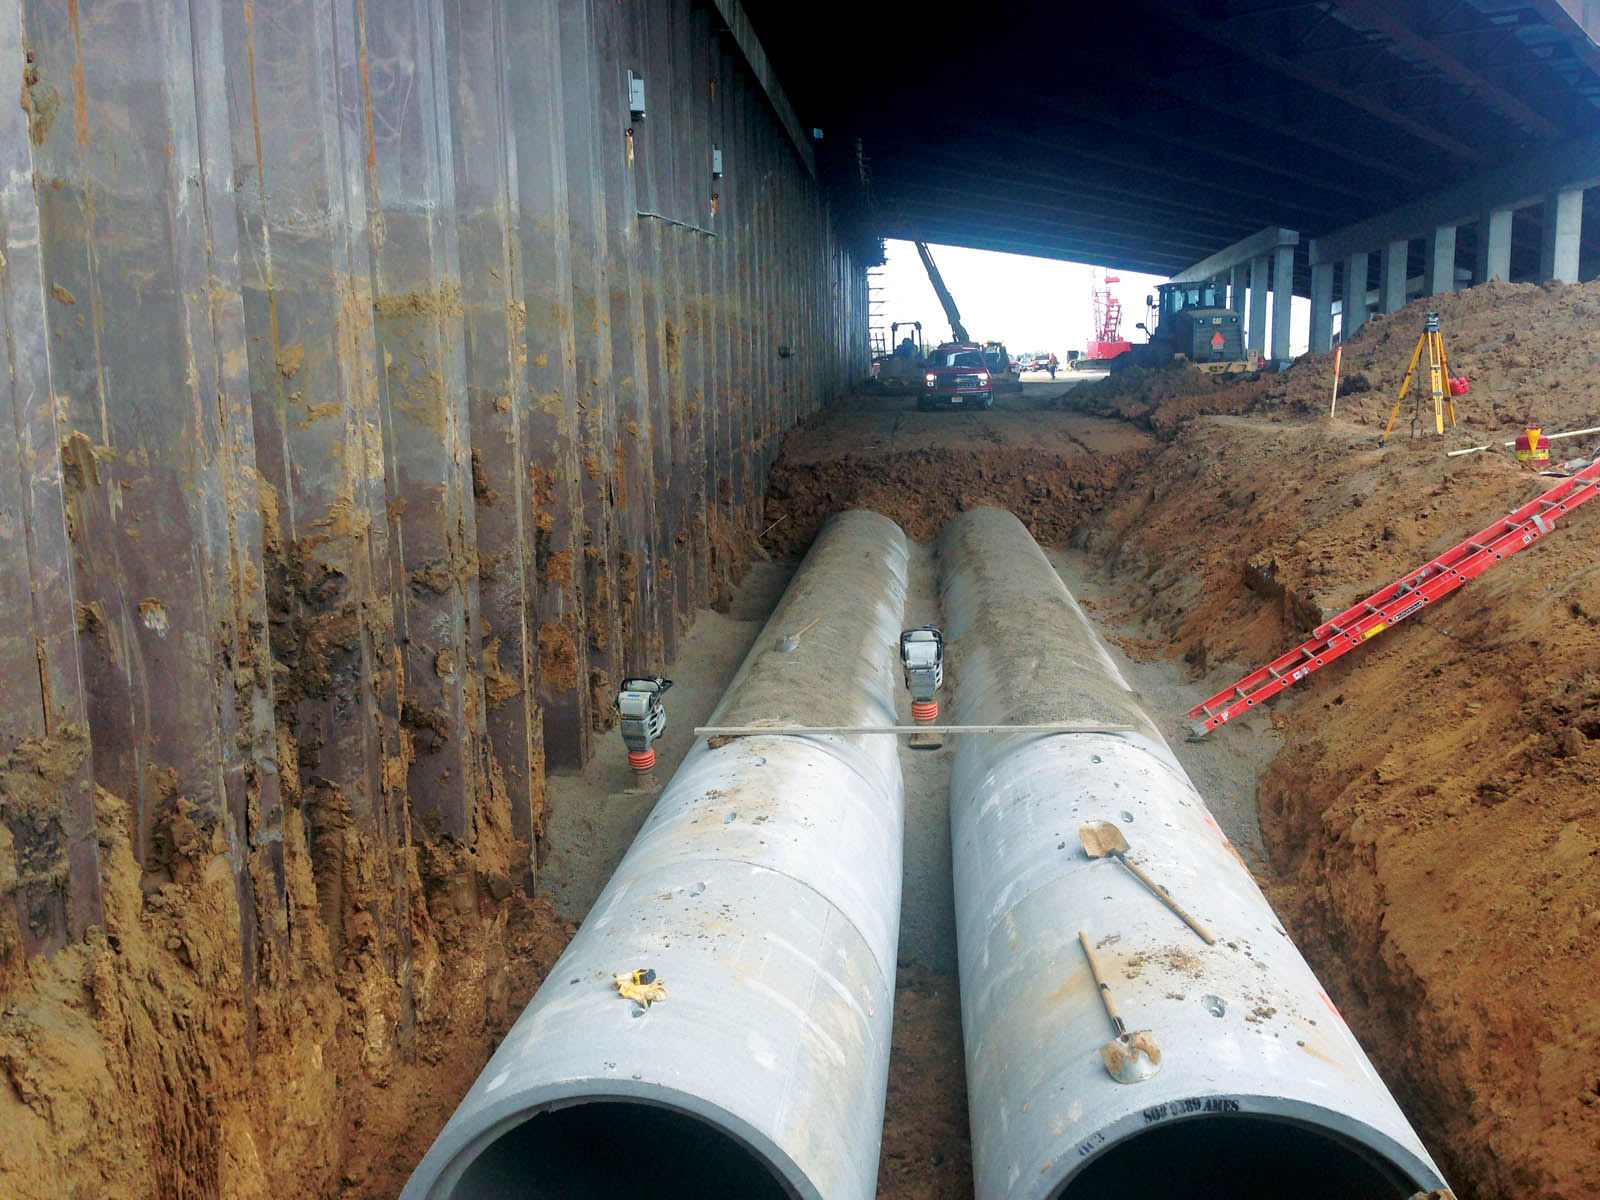
During construction of the GRS abutment and approach fill, excessive movement or strains were not evident in the instrumentation data. Bridge construction was completed in June 2015. An L-Wall (Figure 3) was placed against a portion of the sheet-pile wall where the sheet pile was temporarily unsupported with tie-rods due to the skew of the roadway during a grade-lowering construction phase. In mid-September 2015, the L-Wall was removed. Subsequently, in October 2015, a trench was excavated in front of the sheet-pile wall for installation of twin 60-inch (152-cm) pipes. Figure 4 shows the trench excavation, which was approximately 15 feet (4.57 m) wide and 7 feet (2.13 m) deep. The removal of the L-Wall and the excavation for the twin pipes caused deformation of the sheet-pile wall, which was recorded by the in-place inclinometer.
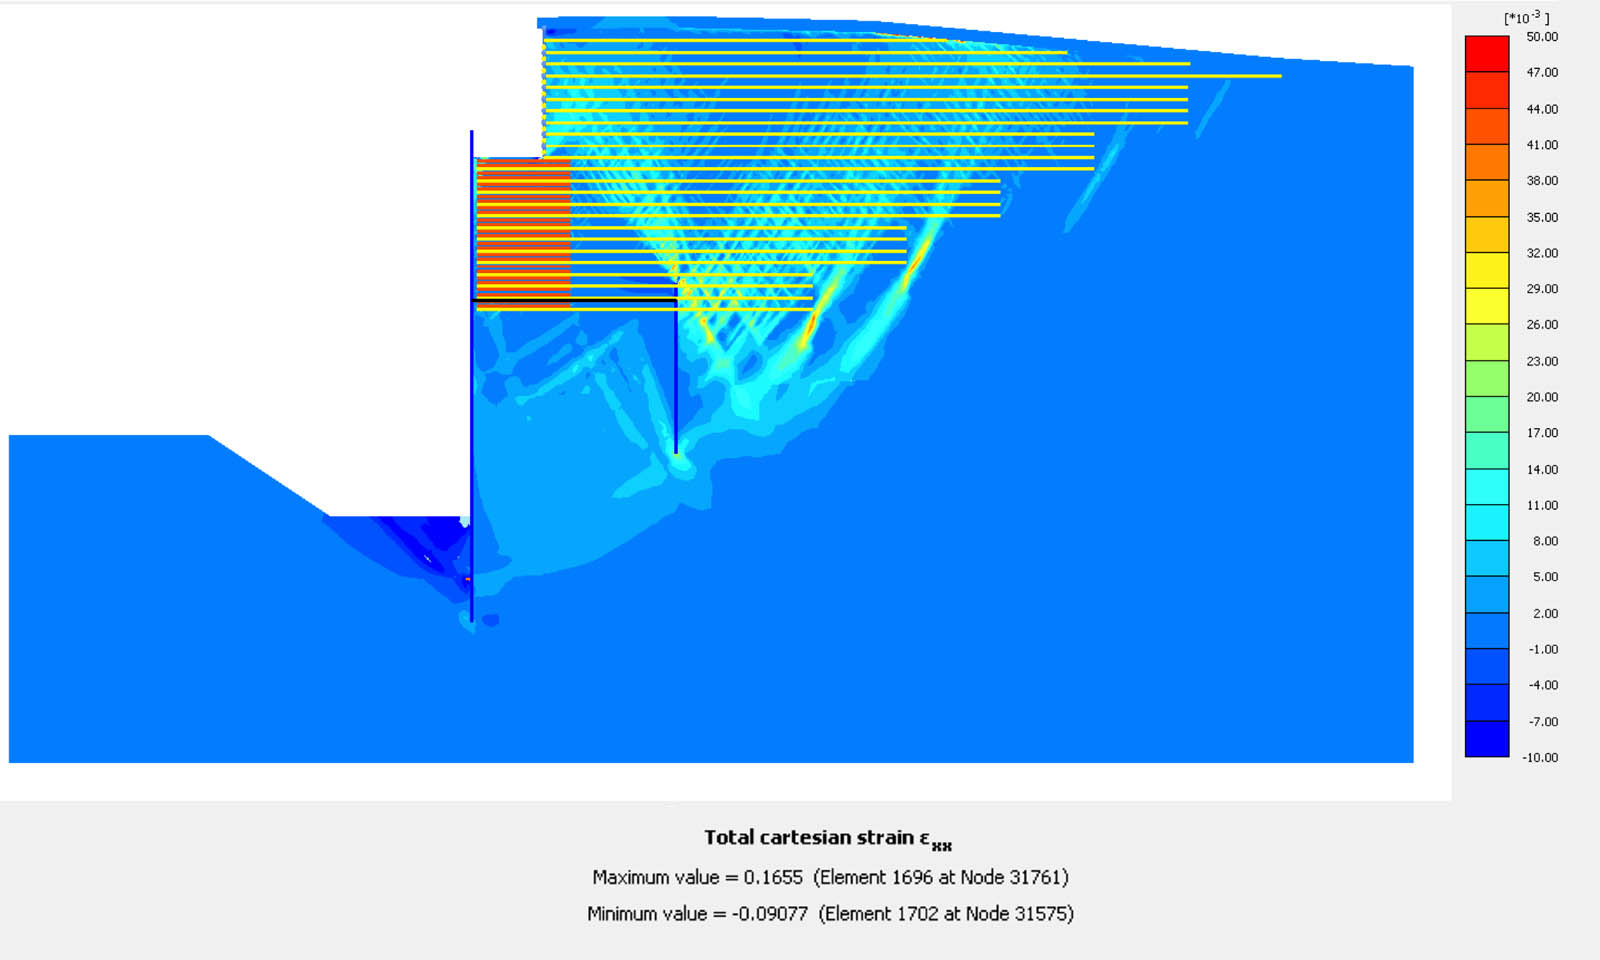
A finite element analysis (FEA) was performed to obtain the distribution of stresses and deformations during the excavations. For the reinforced zone, the model assumed the unit weight of the fill at 95% maximum dry density. For the underlying silty/sand clay, the undrained shear strength was assumed to be 1,000 pounds-force/foot (15 kN/m) at the toe of the wall and increased by 0.22σ’v below. The concentration of strains around the deadman anchor indicated that the deadman anchor and tie-rod strained during the excavations. Results of the analysis are shown in Figure 5.
The instrumentation was utilized throughout the construction process to evaluate performance of the sheet-pile and deadman anchor system as well as the GRS abutment.
Instrumentation evaluation
The total maximum deflection measured during all construction stages was 2 inches (50.8 millimeters). During removal of the L-Wall and excavation for the trench, approximately 1.2 inches (30.5 mm) of deflection was measured.
The tie-rod between the sheet-pile facing and the deadman anchor was instrumented with a strain gauge. Strains increased in the tie-rods significantly during the removal of the L-Wall and excavation for the twin 60-inch (152-cm) pipes. During backfilling for the pipes, the strain in the tie-rods decreased. Although the excavations resulted in large sheet-pile movements and increased strains in the tie-rods, the reinforcement in the GRS abutment exhibited very little increase in strain.
Figure 6 displays laboratory tensile strength vs. strain behavior for both the woven geotextile reinforcement and the geotextile sensor strip. Since the woven geotextile was installed with the stiffer cross-machine direction perpendicular to the wall face, and the sensors are measuring strain in the axis perpendicular to the wall face, the cross-direction stiffness of the woven geotextile at 2% strain was used to compute the loads in the reinforcement. The 2% strain value was used since the strains that were measured during construction of the wall were less than 2% strain.
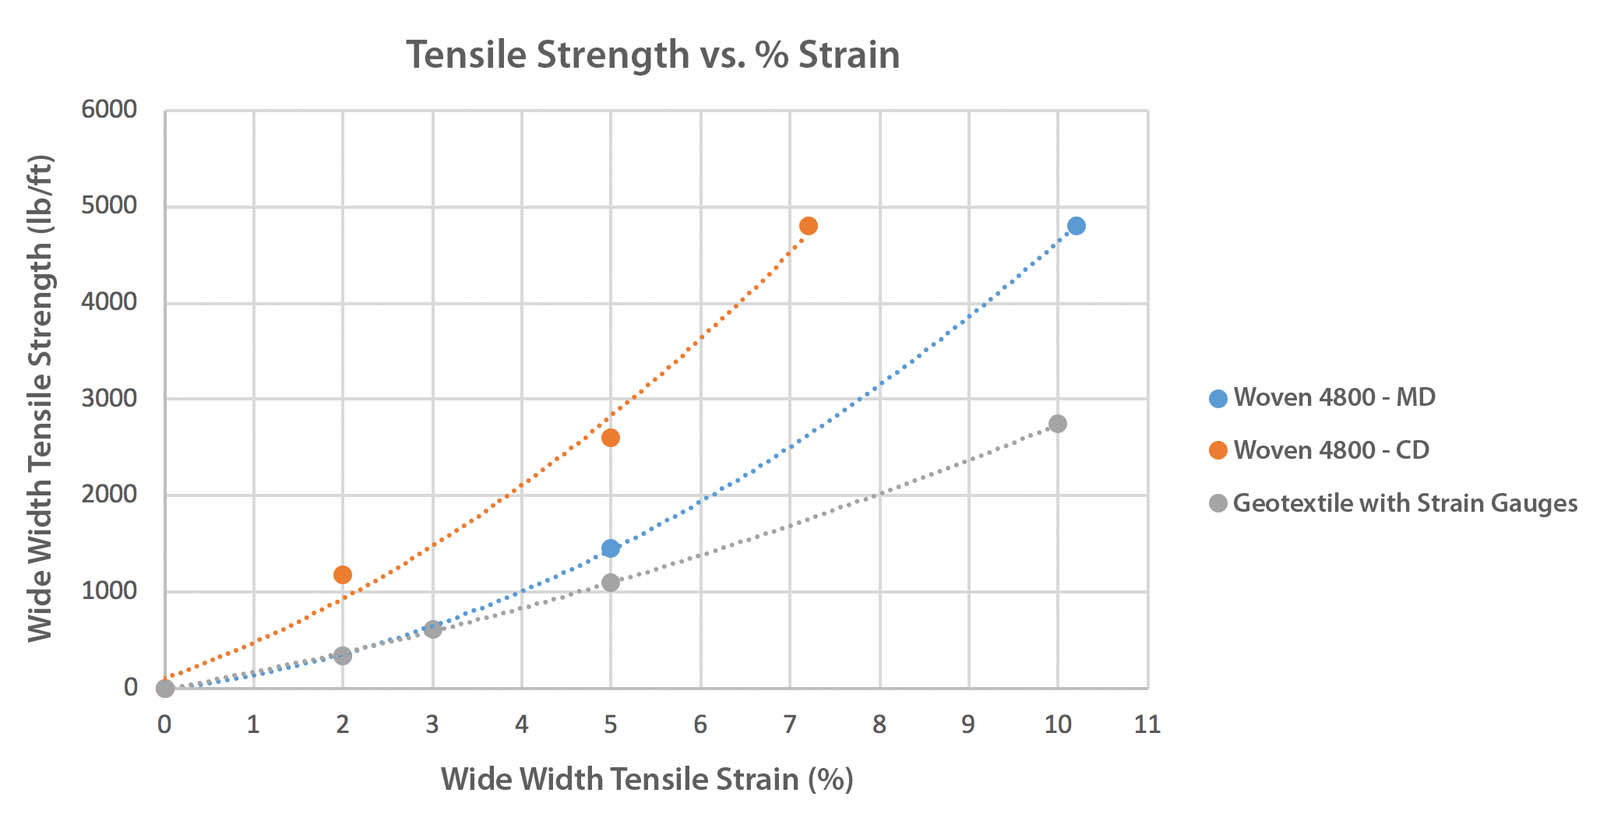
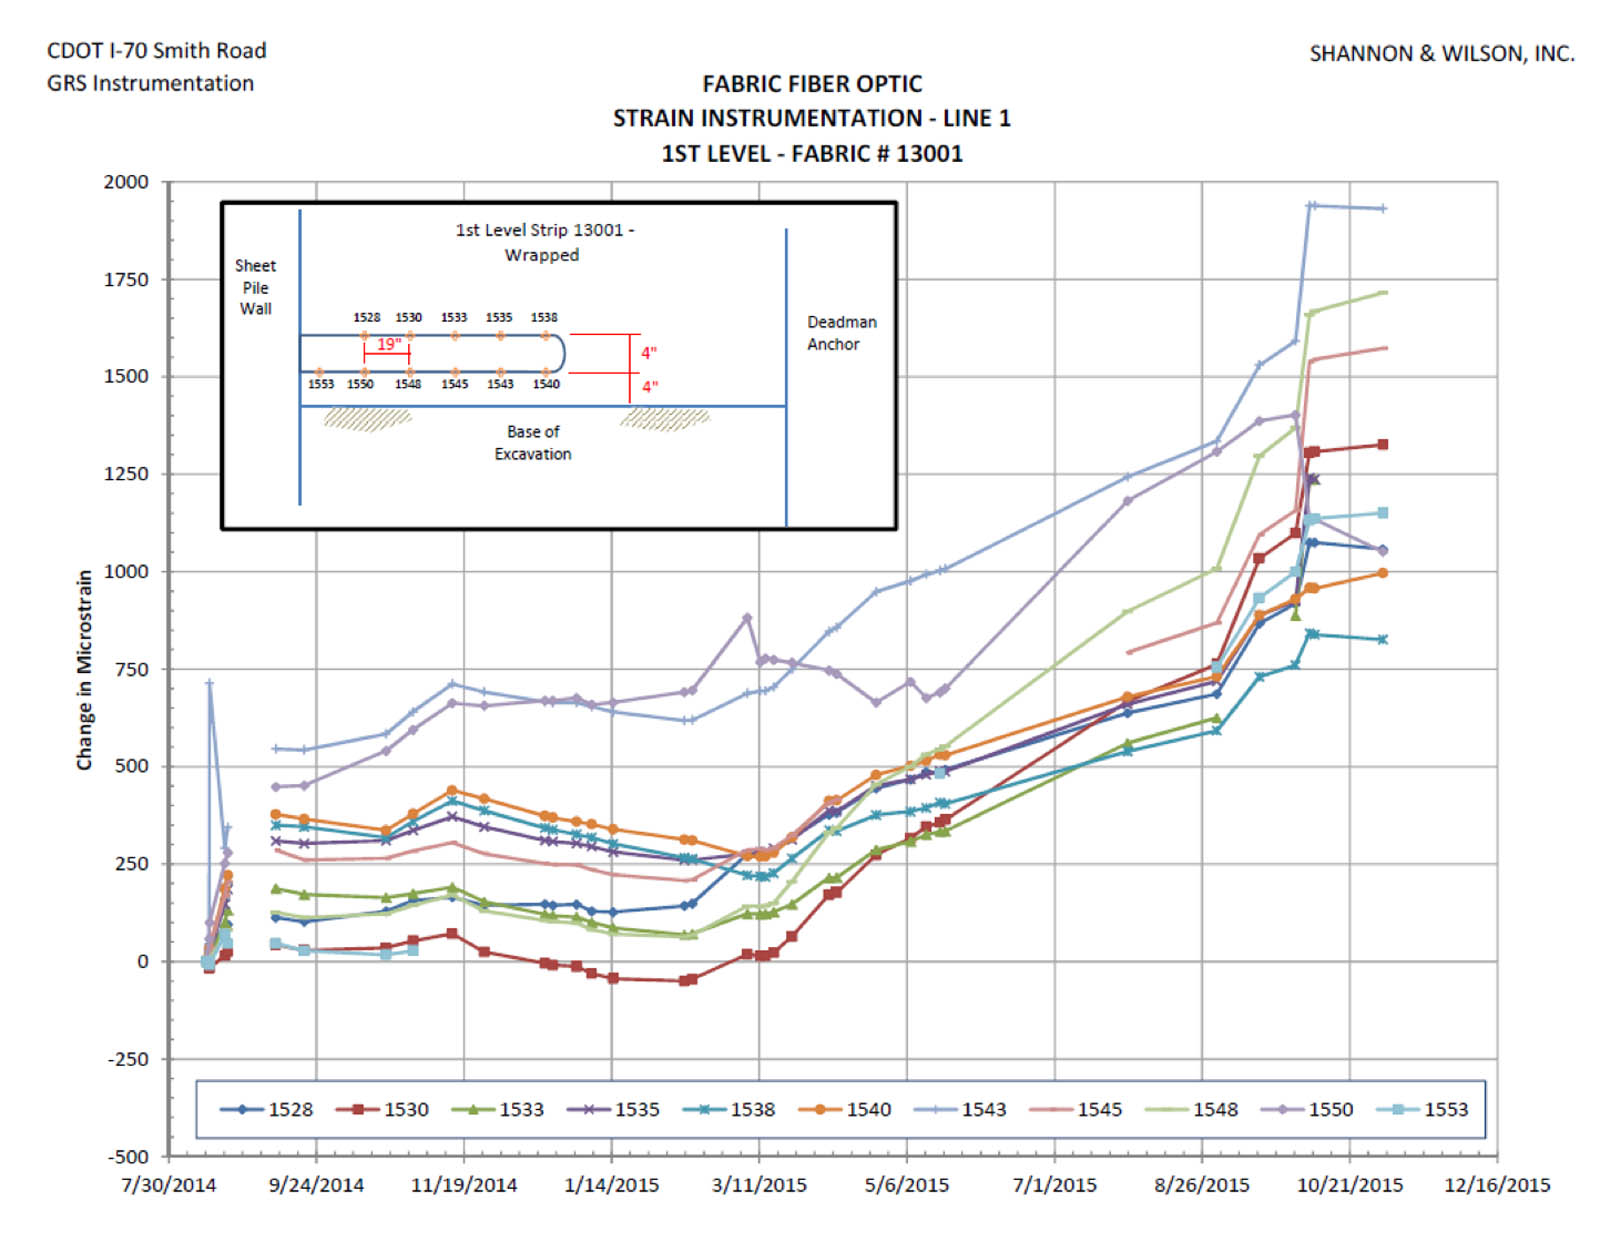
Figure 7 shows the measured strains during construction at elevation 5,508.5 feet (1,679 m), near the bottom of the GRS. It is apparent that there was an increase in strains at the time of excavation for the L-Wall and trench. A similar plot was created for each geotextile sensor strip in the abutment.
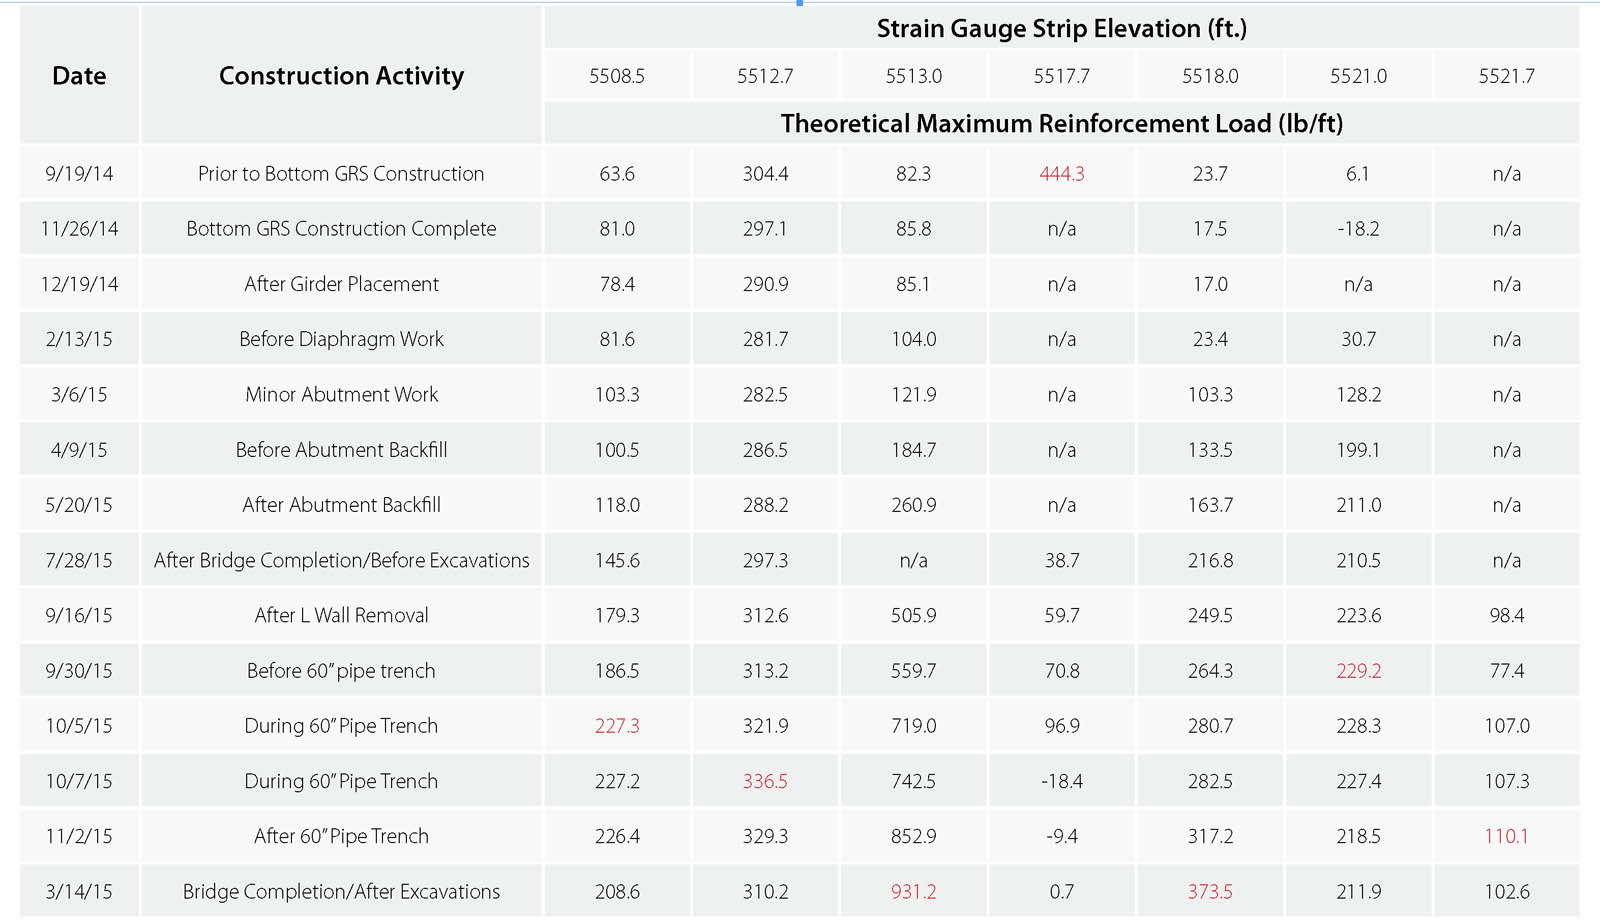
Using the stiffness at 2% strain for the woven reinforcement in the cross-machine direction and the measured strain data collected, maximum re-inforcement loads were computed by multiplying the strain decimals by the stiffness of the woven geotextile reinforcement at 2% strain (1,172 pounds-force/foot [17 kN/m]/2% strain = 58,600 pounds-force/foot [855 kN/m]). The calculated maximum tensile reinforcement loads are shown in Table 1. The maximum reinforcement loads at each elevation that was instrumented is displayed in red.
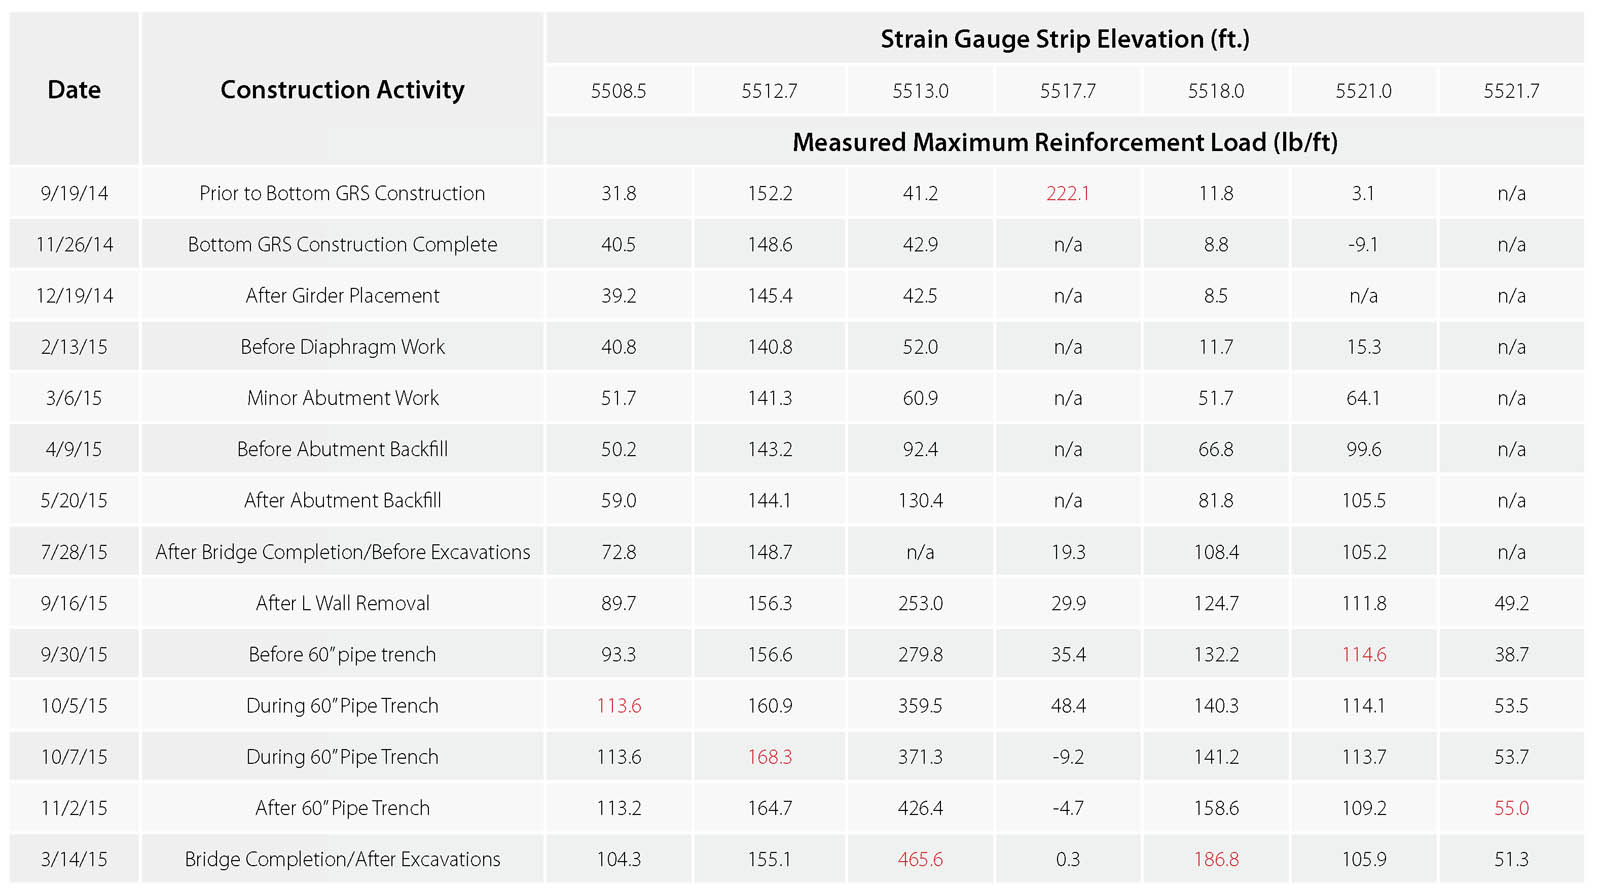
It should be noted that there is more reinforcement at the sensor locations due to the geotextile sensor strip and the woven reinforcement. This could result in the sensors recording local strain that is less than what most of the woven reinforcement is experiencing. Without further investigation and monitoring, this effect cannot be quantified. However, even if the strains locally were under-registering by a factor of two times the measured strain value, all re-inforcement loads interpreted from the strain measurements are lower than the design strength of the woven reinforcement. Table 2 displays this theoretical interpretation of the measured reinforcement loads, which could have under-registered.
To assess the trend of long-term behavior of the reinforcement tensile loads, the loads interpreted from the strain measurements were used as the design strengths and reduced by both the time-dependent and independent parameters using the equation:
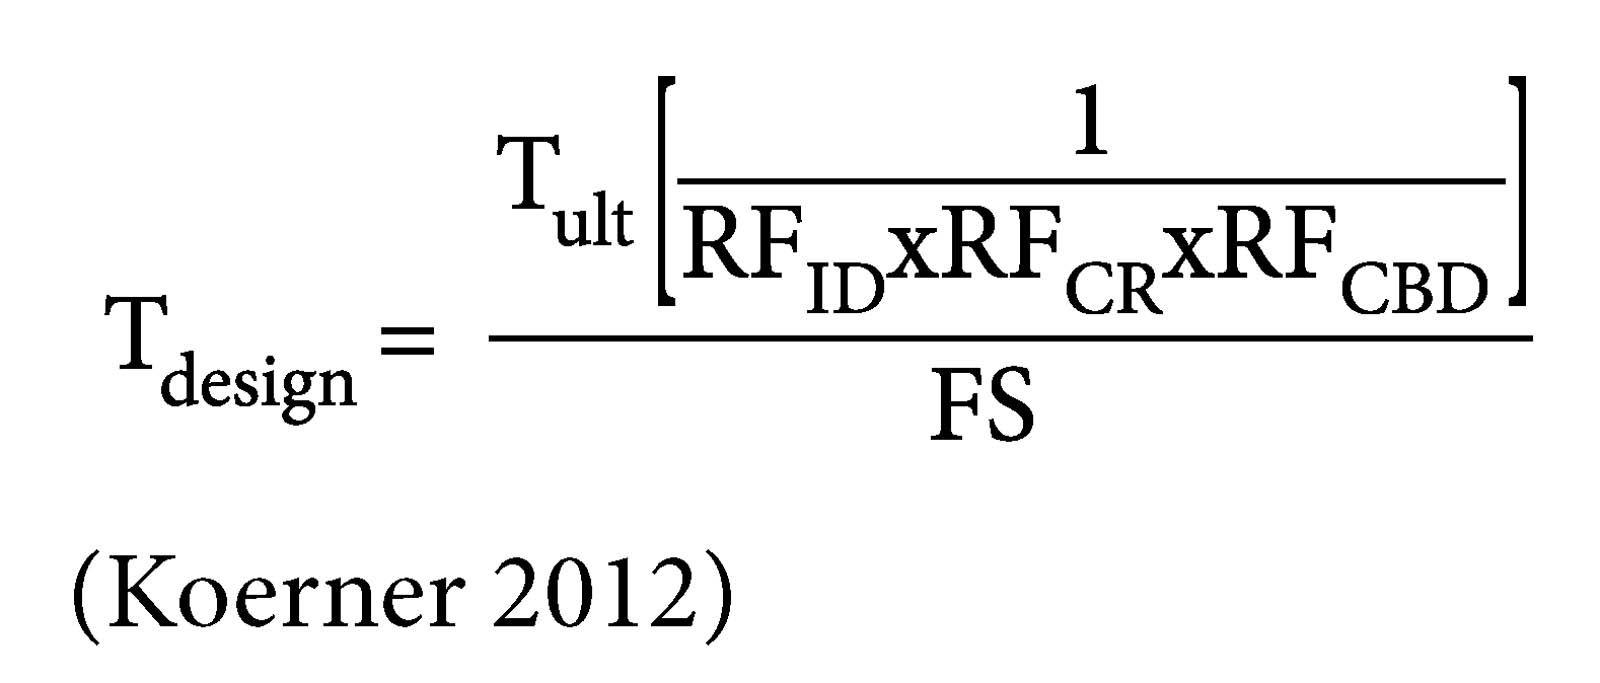
(Koerner 2012)
where:
Tdesign = design strength
Tult = ultimate strength
RFID = reduction factor for installation damage
RFCR = reduction factor for creep
RFCBD = reduction factor for chemical and biological degradation
FS = factor of safety
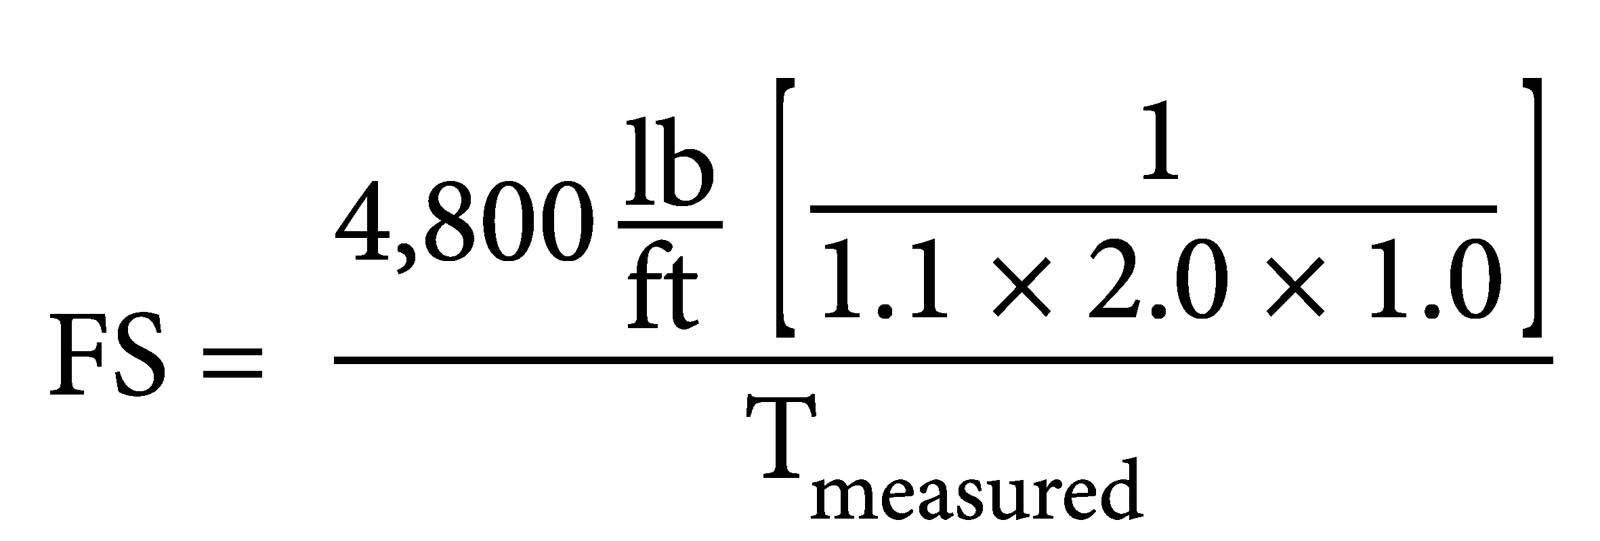
The factor of safety (FS) at the completion of the project was then computed and plotted at each instrumented elevation.
The calculations indicate that for long-term strength behavior, the upper reinforcements are overdesigned, which is common with geosynthetic-reinforced structures. Our data shows with an increase in FS, however, per the earth pressure theory, the lateral stress will be less than predicted at the bottom of the wall.
Conclusions
The temporary excavation in front of the sheet-pile wall abutment created a loading case to evaluate the GRS structure in a stress condition exceeding the long-term design condition. Despite the wall movements of the sheet-pile face during critical construction activities, the strains and hence the interpreted loads determined from measurements in the geotextiles appear within the design performance expectations. Over the past 20 years, GRS–IBS has typically been used for
single-span bridges; however, the results of the instrumentation program during construction and the first service year of this multi-span bridge suggest this technology can be used for multi-span structures. Additionally, the instrumentation data suggest that the sheet-pile deflection and deadman anchors deformation accommodated the total strain prior to engaging the full GRS structure. The data indicate that the reinforcements meet or exceed the long-term behavior requirements for tensile strength.
References
Das, B. M. (2013). Fundamentals of geotechnical engineering, 4th ed., Cengage Learning, Stamford, Conn., 380.
Koerner, R. M. (2012). Designing with geosynthetics, Vol. 1, 6th ed., Xlibris, Bloomington, Ind., 174–175.
Koerner, R. M. and Koerner, G. M. (2011). “Recommended layout of instrumentation to monitor potential movement of MSE walls, berms and slopes.” GRI white paper #19.
Ashley MacMillan, P.E., is engineering business manager with TenCate Geosynthetics Americas in Salt Lake City, Utah.
Joseph C. Goode III, P.E., AM.ASCE, is senior geotechnical engineer with Shannon & Wilson Inc. in Denver, Colo.
Martin Hawkes, P.E., is senior engineer with Geocomp Corporation in Acton, Mass.