 TEXTILES.ORG

Over the decades, soil mass reinforced by layers of geosynthetics has been used widely and successfully in a variety of earth structures, such as mechanically stabilized earth (MSE) retaining walls, embankments, slopes and shallow foundations. Due to the proven benefits of geosynthetic reinforced soil (GRS), including cost-effectiveness, simple and fast construction, and tolerance of differential settlements, the technology has been extensively employed for transportation infrastructure to support bridge structures, the self-weight of bridge backfill materials and bridge traffic load. The application of the GRS technology to bridge-supporting structures, particularly for bridge abutments, has been gaining popularity due to its proven advantages over traditional bridge abutments (Abu-Hejleh et al. 2000a, Abu-Hejleh et al. 2000b, Adams 1997, Mohamed et al. 2011, Wu et al. 2001, Wu et al. 2006). Recognizing the benefits of using GRS for abutments, some states and local agencies have been proactive in adopting the GRS abutment technology (Adams et al. 2007a, Adams et al. 2007b). The Federal Highway Administration (FHWA) is actively promoting the GRS abutment technology and included it in the Every Day Counts (EDC) initiative to accelerate its nationwide implementation.
The GRS technology involves using alternating layers of geosynthetics, mainly woven geotextiles or geogrids, and granular geomaterials. Because of the narrow spacing between geosynthetics (≤ 12 inches [30 cm]), GRS is deemed to behave as a composite mass, meaning the geosynthetics closely interact with the backfill materials (Pham 2009, Wu et al. 2014). Through both laboratory tests on large-scale or full-scale GRS abutments and field studies on in-service GRS abutments, the behavior and characteristics of GRS abutments were investigated to reveal the benefits of using GRS for bridge abutments. The influential factors on the behavior of the GRS mass include spacing between geosynthetics, geosynthetic type/stiffness and embedded length, and the interaction characteristics between geosynthetics and backfill materials (Adams et al. 2007a, Adams et al. 2007b, Pham 2009, Wu et al. 2014). The design methods and construction techniques for GRS abutments have evolved along with the numerous studies conducted on GRS abutments. The FHWA has released one synthesis and one implementation manual covering the background, design, construction and performance of GRS abutments (Adams et al. 2007b). The current design for GRS bridges is largely empirical-based, requiring verification/validation for local materials, subsurface conditions and practice. Additionally, the important design parameters—such as stresses and deformations of GRS abutments—need to be verified against the current FHWA design method. In this article, the measurements of a fully instrumented GRS bridge were used to monitor the strength and deformation characteristics of the GRS abutment during and after construction.
The Maree Michel Bridge
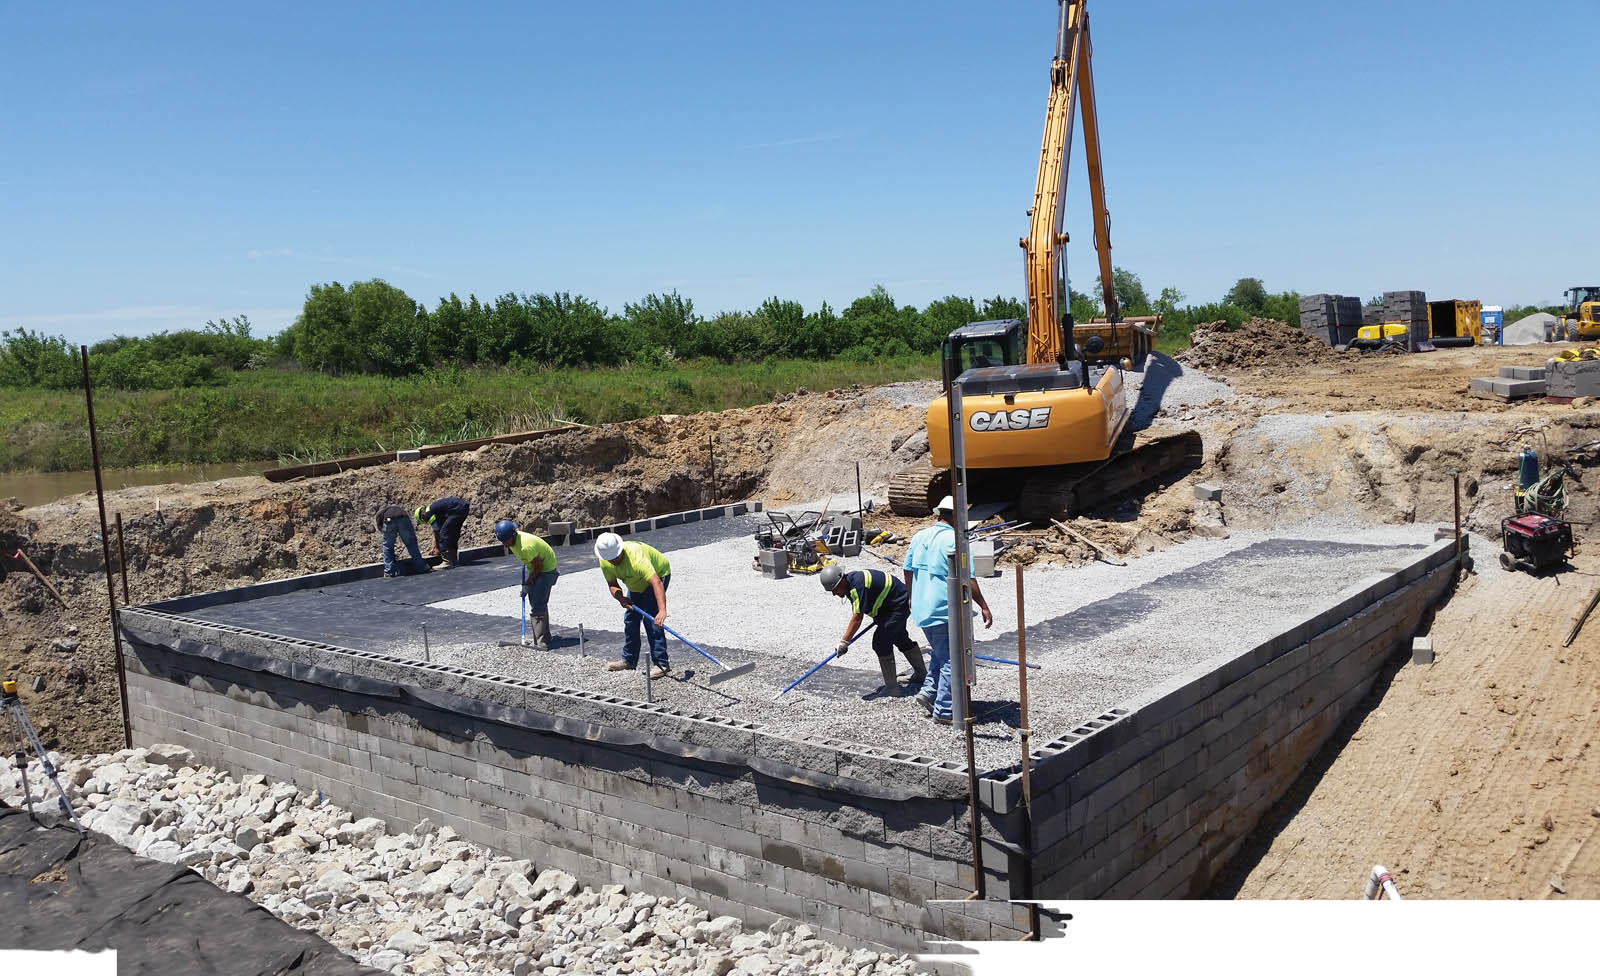
Recognizing the potential benefits of using geosynthetic reinforced soil–integrated bridge systems (GRS–IBS) for local bridges, the Louisiana Department of Transportation and Development (LA DOTD) chose to build the first GRS–IBS abutments for the single-span Maree Michel Bridge (Figure 1) on Louisiana Route 91 in Vermilion Parish, about 180 miles (290 km) west of New Orleans. For proper design of the GRS–IBS, several site-exploration tests, including boreholes, soil sampling and associated laboratory soil testing, were performed to determine the foundation soil conditions. Field exploration indicates that the foundation soil consists mainly of high plasticity clay (CH), according to the Unified Soil Classification method. Laboratory testing of representative soil samples indicated that the total in-place unit weight ranged from 109 to 110 pounds/foot3 (1,746–1,762 kg/m3), natural gravimetric water content ranged from 23% to 49%, liquid limit (LL) ranged from 45% to 84% and the plasticity index (PI) ranged from 35% to 56%. The groundwater table was encountered at about 5 feet (1.5 m) below the existing ground surface. The maximum height of the GRS abutment is 15.6 feet (4.8 m) from the bottom of the reinforced soil foundation (RSF) to the road pavement, the width of the abutment is 43 feet (13 m) and the girder span is 72 feet (22 m). The overall width of the bridge superstructure is 30 feet (9.1 m). The bridge was built with a precast concrete superstructure, and its GRS abutments were constructed using locally available materials. The width of the beam seat bearing area on each abutment was determined to be 5 feet (1.5 m) based on the FHWA design procedure. The vertical space between the reinforcement layers of GRS was 8 inches (20 cm). However, for the top five layers of abutment, secondary reinforcement was added in the middle of each layer to increase the bearing load carrying capacity.
For this project, the abutment’s structural fill consisted of an open-graded crushed rock with a maximum particle size of 0.5 inch (12.7 mm) and less than 5% passing the No. 16 (1.19 mm) sieve. The aggregate had a maximum dry density (γd-max) of 133 pounds/foot3 (2,130 kg/m3) and an angle of internal friction (ϕ) of 50.9o based on large-size direct shear testing. The backfill material was compacted to a minimum of 95% of γd-max, according to the American Association of State Highway and Transportation Officials (AASHTO) T 99. In the bearing bed and beam seat, the backfill material was compacted to 100% of γd-max. The RSF was constructed with the same backfill material as the abutment. The reinforcement for the abutment and the RSF consisted of woven geotextile with an ultimate tensile strength of 4,800 pounds/foot (6.5 kN/m). The facing elements consisted of nominal 8 inches × 8 inches × 16 inches (20 cm × 20 cm × 41 cm) concrete masonry units (CMUs) with a compressive strength of 4,000 psi (27.6 MPa). The construction of the instrumented abutment began on April 6, 2015, and was complete on April 28, 2015. After the abutment construction was completed, seven steel girders were placed on May 5, 2014. The construction of the integrated approach slab was complete on July 27, 2015.
Instrumentation plan
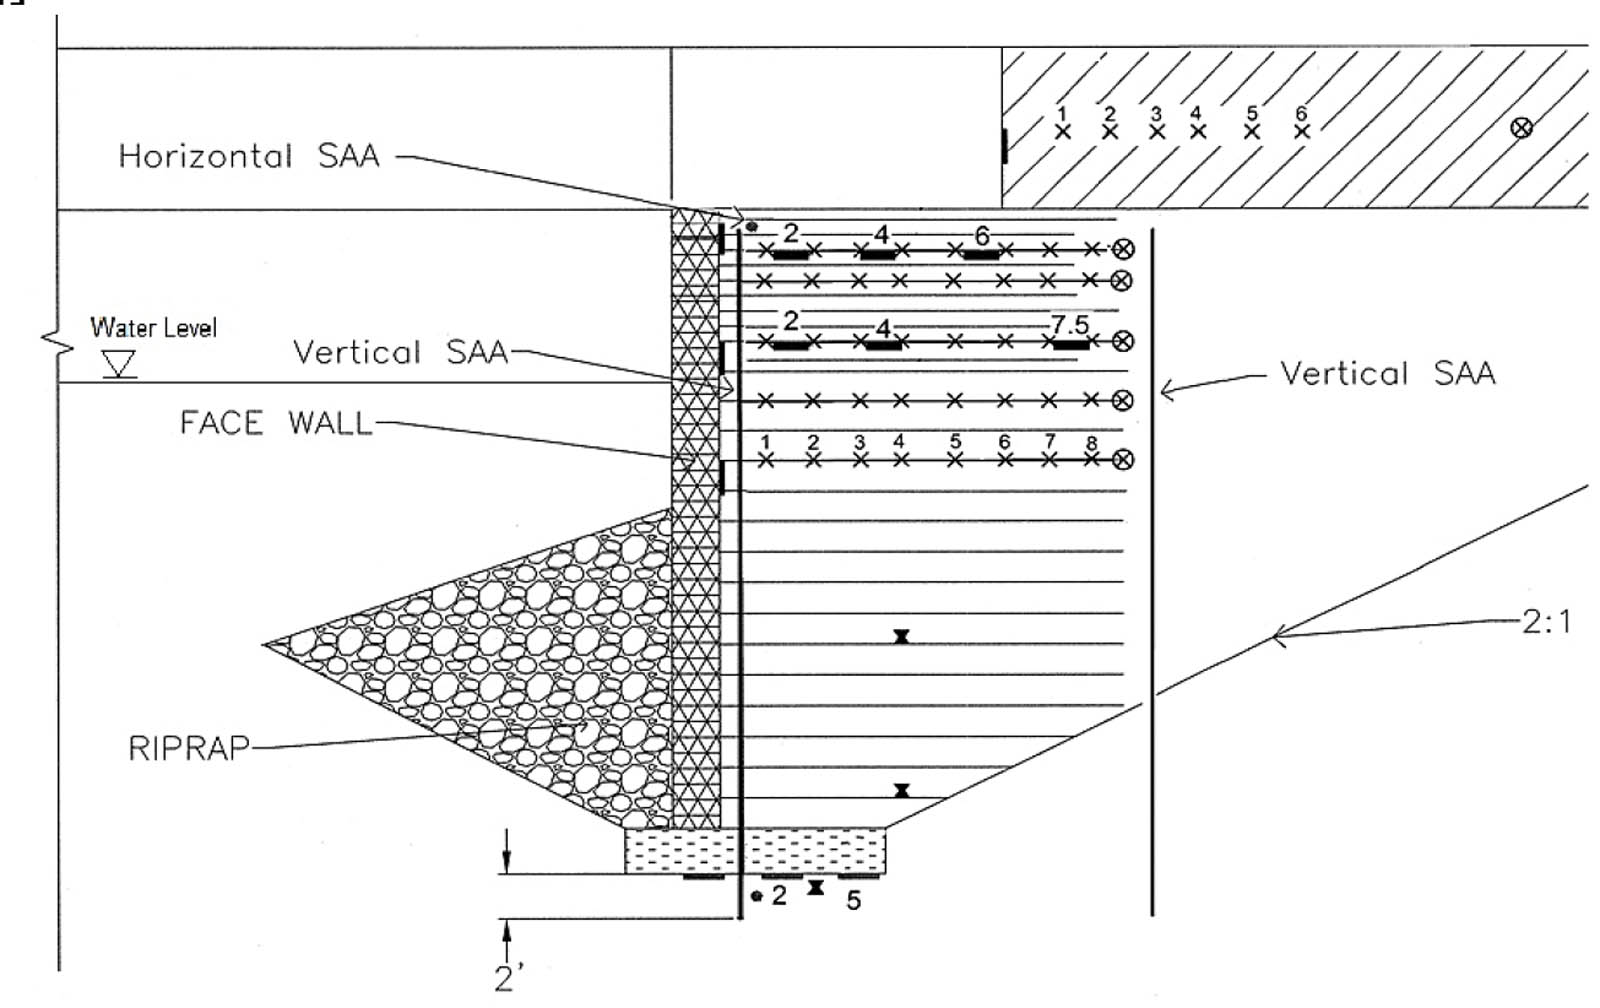
In order to monitor the performance of the in-service GRS–IBS abutment, various types of instrumentation were installed in the south abutment of the bridge. An instrumentation plan was developed to measure the load- and environment-associated responses and performance of the GRS–IBS abutments (Figures 2a and 2b on p. 28). The primary measurements included the vertical and horizontal deformations near the front wall, settlements below RSF, deformations of GRS–IBS backfill, stress distributions in the GRS–IBS abutment and below RSF, and the strain distributions along the geosynthetic reinforcements. Additionally, the pore water pressure and temperature were monitored by piezometers and thermocouples. Five different types of instrumentation (as well as surveying) were used to monitor the GRS–IBS bridge abutment: shape-acceleration array (SAA), earth pressure cells, strain gauges, piezometers and thermocouples. The surveying was conducted at the bridge surface upon the completion of construction.

The SAA was used to measure the GRS–IBS abutment deformations and settlement because of its reliability and successful applications for other geotechnical structures (Abdoun et al. 2008). Two vertical SAA were installed at the center of the abutment, 2 feet (0.6 m) behind the face of the wall and 10 feet (3 m) behind the wall. The bottoms of the vertical SAA were located 2 feet (0.6 m) below the RSF, while the tops of the SAA were leveled with the backfill surface. The vertical SAA measured the lateral deformations throughout the depth of the GRS–IBS abutment. Additionally, two sets of horizontal SAA were installed 3 feet (0.9 m) behind the face of the wall, one at 1 foot (0.3 m) below the RSF and one at the top layer of the abutment. The ends of the horizontal SAA were attached to settlement plates. A survey of settlement plates was used to adjust the SAA readings. The vertical SAA have a segment length of 12 inches (0.3 m) between sensors. Since the horizontal profile of the GRS–IBS abutment settlement is expected to be approximately symmetric, the horizontal SAA need fewer sensor nodes and have a segment length of 19.7 inches (50 cm).
Hydraulic earth pressure cells (Geokon Model 4800) were used to measure the vertical and horizontal stresses. These pressure cells are capable of measuring both static and dynamic stresses. A total of 12 earth pressure cells were installed in the GRS–IBS abutment at different locations. Three pressure cells were installed underneath the RSF to measure the distribution of the vertical total pressure. Three pressure cells were installed behind the face wall to measure the horizontal total pressure. Six pressure cells were installed in the bearing reinforcement zone at Level 16 and Level 19 to measure the distribution of the total vertical pressure within the zone. Three semiconductor-type piezometers were installed to measure the developed pore water pressure. Along with the measurement of total stresses from earth pressure cells, the measurement of pore water pressure can be used to examine the effective stresses in the GRS–IBS abutment. The three piezometers were installed at the bottom, one-third and two-thirds of the height from the bottom of the GRS–IBS abutment, respectively. Electrical resistance strain gauges were installed on the geosynthetic reinforcements to measure the mobilized strains along the geosynthetics. The reinforcement tensile forces developed in the geosynthetics can be estimated from the strain measurements and the elastic modulus of the geosynthetic materials. A total of 55 strain gauges were installed on five geosynthetic layers in the abutment as shown in Figure 2a.

FIGURE 4 Settlement and vertical deformation during the construction of GRS abutment
Performance monitoring
The main objective of this research study was to monitor the short-term and long-term performance behavior of the GRS–IBS abutments at the Maree Michel Bridge, and to verify important design factors and parameters for the GRS–IBS abutment, mainly deformations and stresses involved in both external and internal stability analyses. For this purpose, an instrumentation plan was developed to measure the load-associated and environment-associated responses of the GRS–IBS abutments during the construction phase and under service load. Specifically, the monitoring program consisted of measuring the vertical and horizontal deformations of the GRS–IBS abutment, settlements due to the soil foundation and the GRS–IBS backfill, the distribution of stresses within the GRS–IBS abutments and below RSF, and the distribution of strains along the geosynthetic reinforcements. Additionally, the pore water pressure and temperature were monitored by piezometers and thermocouples.
Settlement and deformation measurements
The GRS–IBS abutment is expected to experience settlements and deformations along with construction progress and passing time. The deformation characteristic of the GRS–IBS abutment is a critical indicator of the performance of the GRS–IBS abutment for internal and external stability, particularly the deformations near the facing wall. The bridge deformations were monitored starting shortly after the beginning of construction (April 8, 2015) to 68 days after completion of abutment construction and before the placement of the integrated approach slab (July 28, 2015). Figure 3 shows the settlement profile of the soil foundation measured during construction. As expected, the maximum settlement was increased with lift placement, with more movements occurring near the center of the abutment than the corners.
FIGURES 6a and 6b Locations of maximum strain at two stages of construction: (a) before placement of steel girders and (b) after placement of steel girders
The maximum deformations of the soil foundation as well as the GRS abutment are illustrated in Figure 4. The increase of settlement foundation soil was fast in the early stages of construction; however, the rate of increase in settlement decreased with time. The deformation measurements indicate that the maximum total settlements across the GRS abutment was less than 0.25 inch (6 mm). About 70% of the abutment deformation (0.18 inch [5 mm]) was due to settlement of foundation soil, and less than 30% of total deformation happened within the abutment and RSF. A small amount of deformation in the GRS proves that the closely placed reinforcement can reduce and suppress dilation of soil mass. The majority of backfill deformations happened by the end of GRS construction on April 28, 2015, which did not change significantly with time. Overall, the GRS abutment performed satisfactorily during the construction in terms of measured settlements and deformations. The maximum deformation of the abutment was significantly less than the design value of 0.8 inch (2 cm).
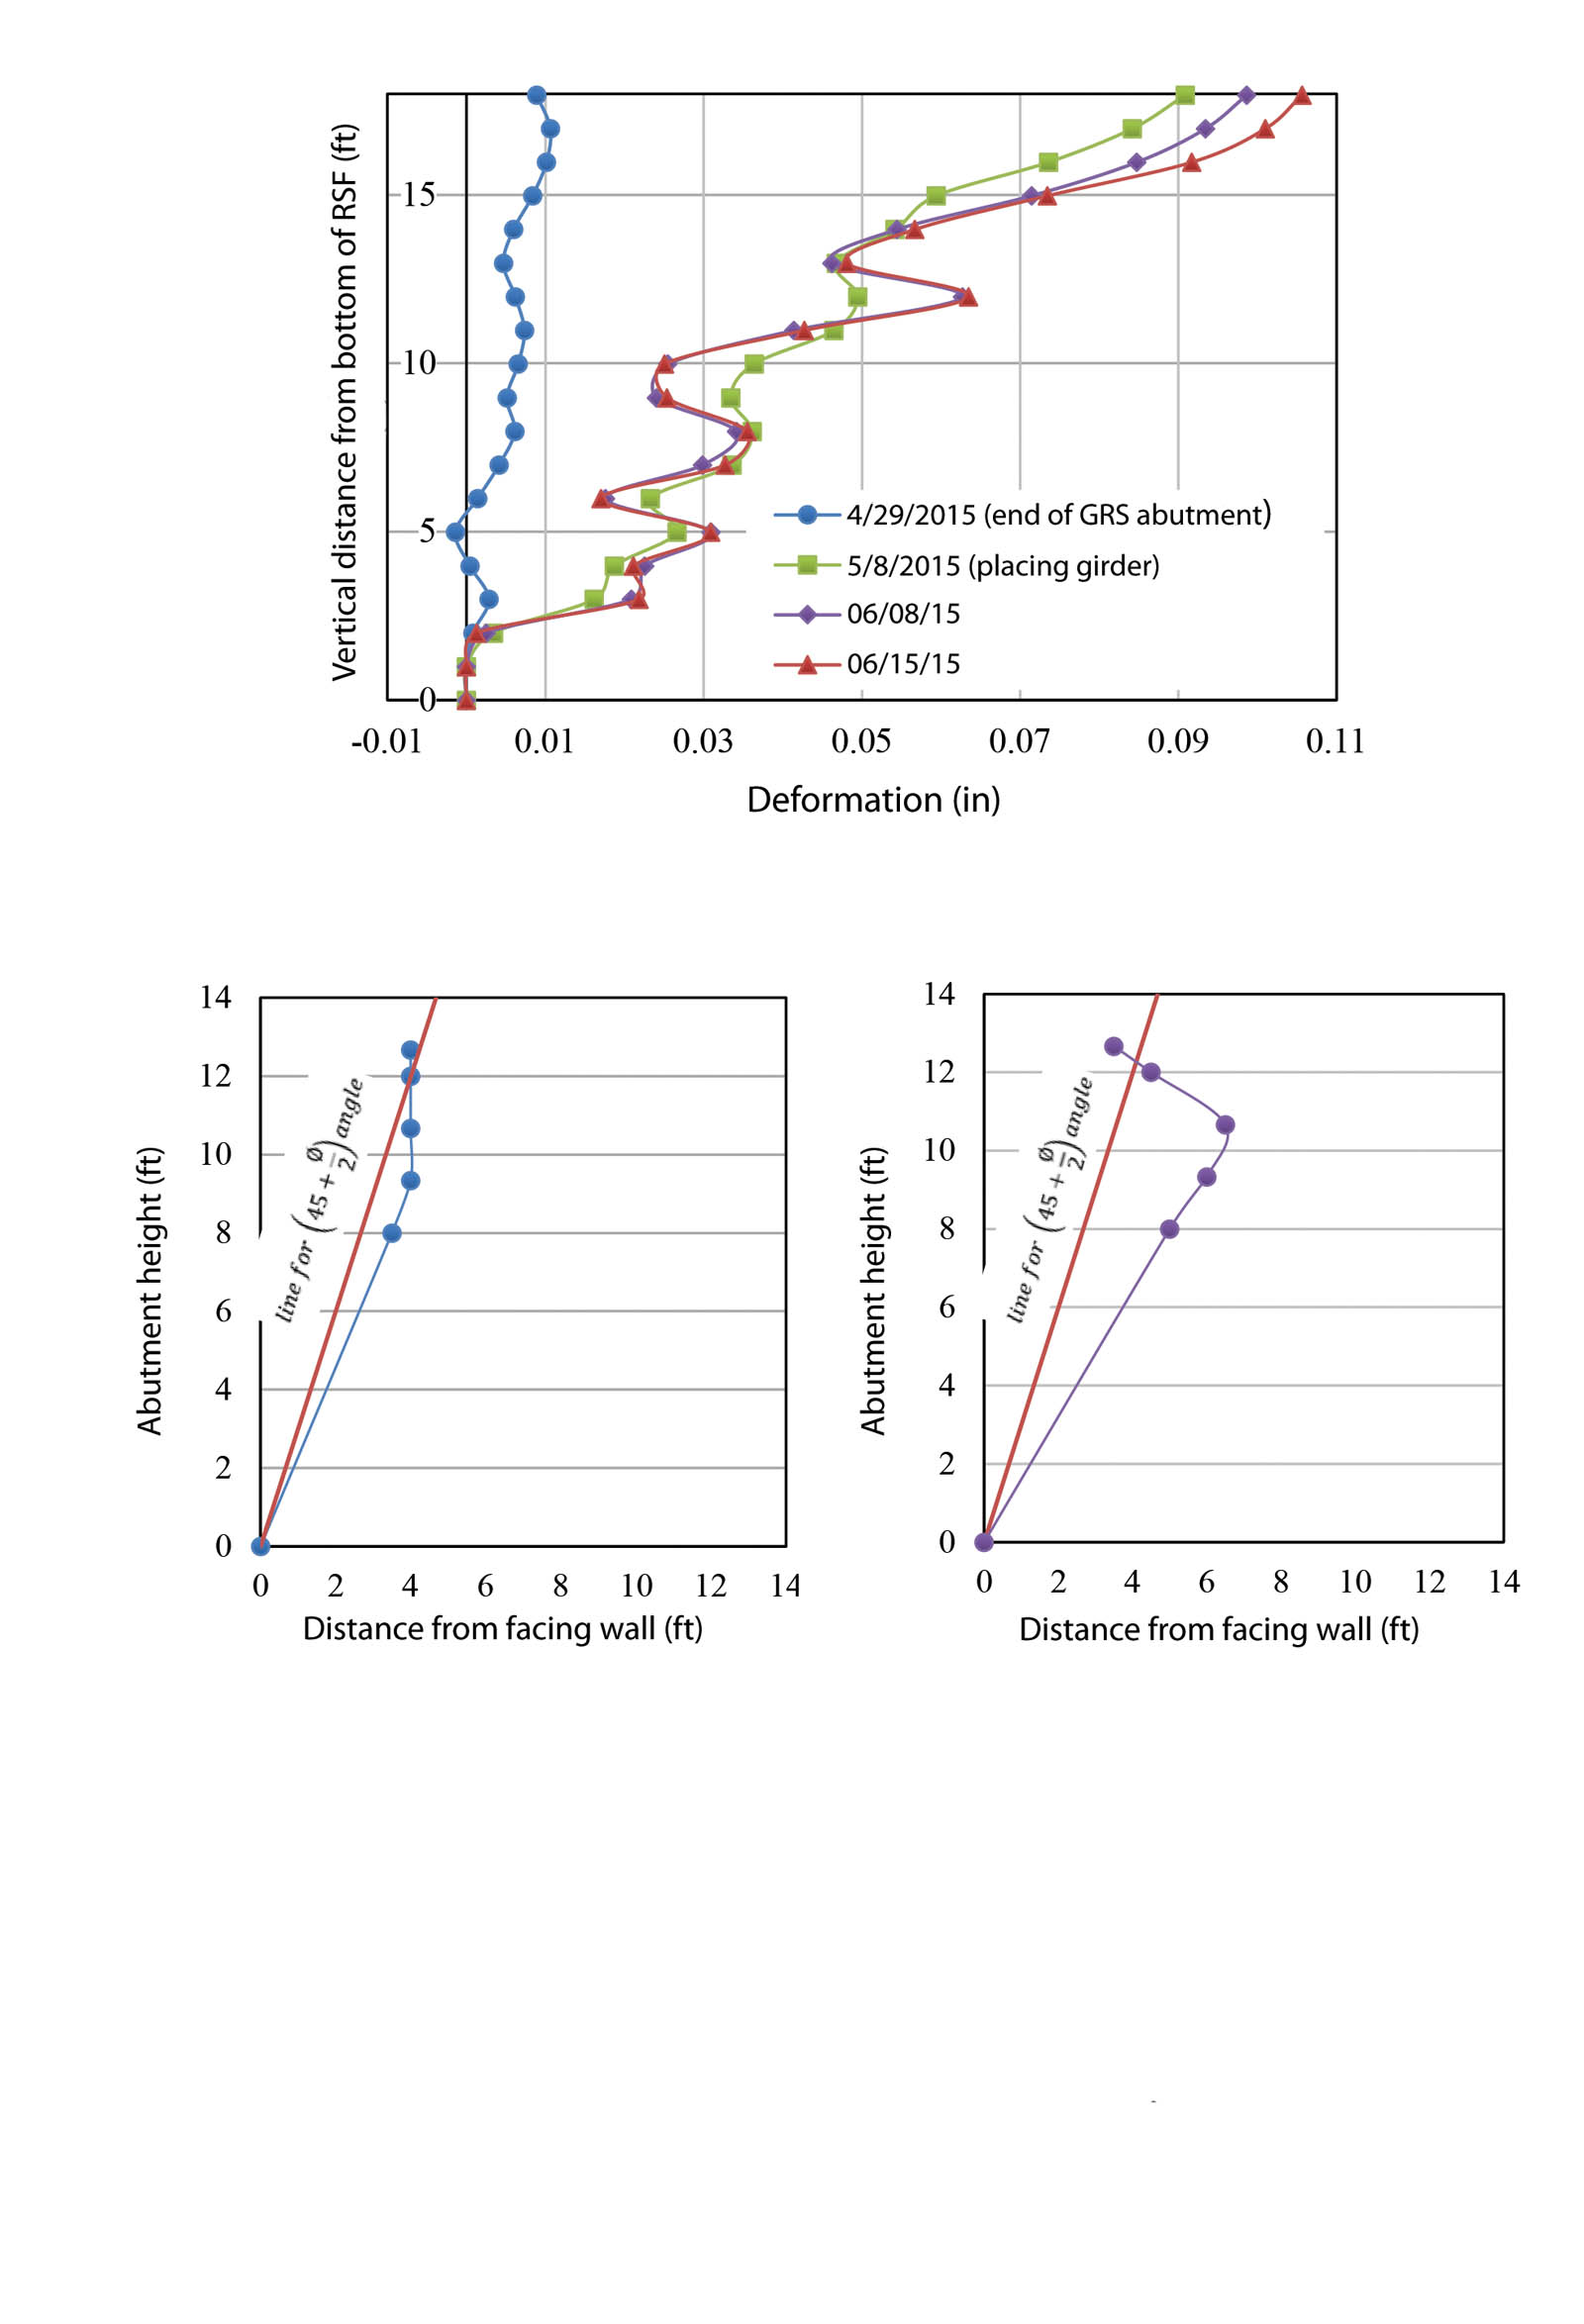
Figure 5 presents the lateral movements of the abutment at the location of 2 feet (0.6 m) behind the facing wall. The figure demonstrates that the maximum lateral movement occurred near the top of the wall. Following the construction of the bridge abutment, the facing wall experienced some appreciable outward (away from backfill) lateral displacements. After placing the steel girders on May 8, 2015, the lateral movement close to the wall significantly increased from 0.01 inch (0.3 mm) (measured after completing the construction of the GRS abutment on April 28, 2015) to 0.09 inch (2 mm).
Estimation of failure surface
The critical failure surface is assumed to be the surface connecting the locus of maximum strains in each layer. The locations of maximum reinforcement strains with depth are plotted in Figures 6a and 6b. The figures show that the maximum reinforcement strains before placement of the steel girders formed a bilinear surface with an angle slightly lower than the theoretical Ka failure surface (line of 45o + ф/2 angle) up to 9 feet (2.7 m) height, followed by a vertical surface. However, after placement of the steel girders, the distance of linear surface representing the locus of maximum reinforcement strains increased with the abutment height up to a certain level before it decreased sharply (Figure 6b). The maximum distance of locus of maximum strains from the wall facing occurs at about two-thirds the height of the abutment.
Measurement of soil stresses
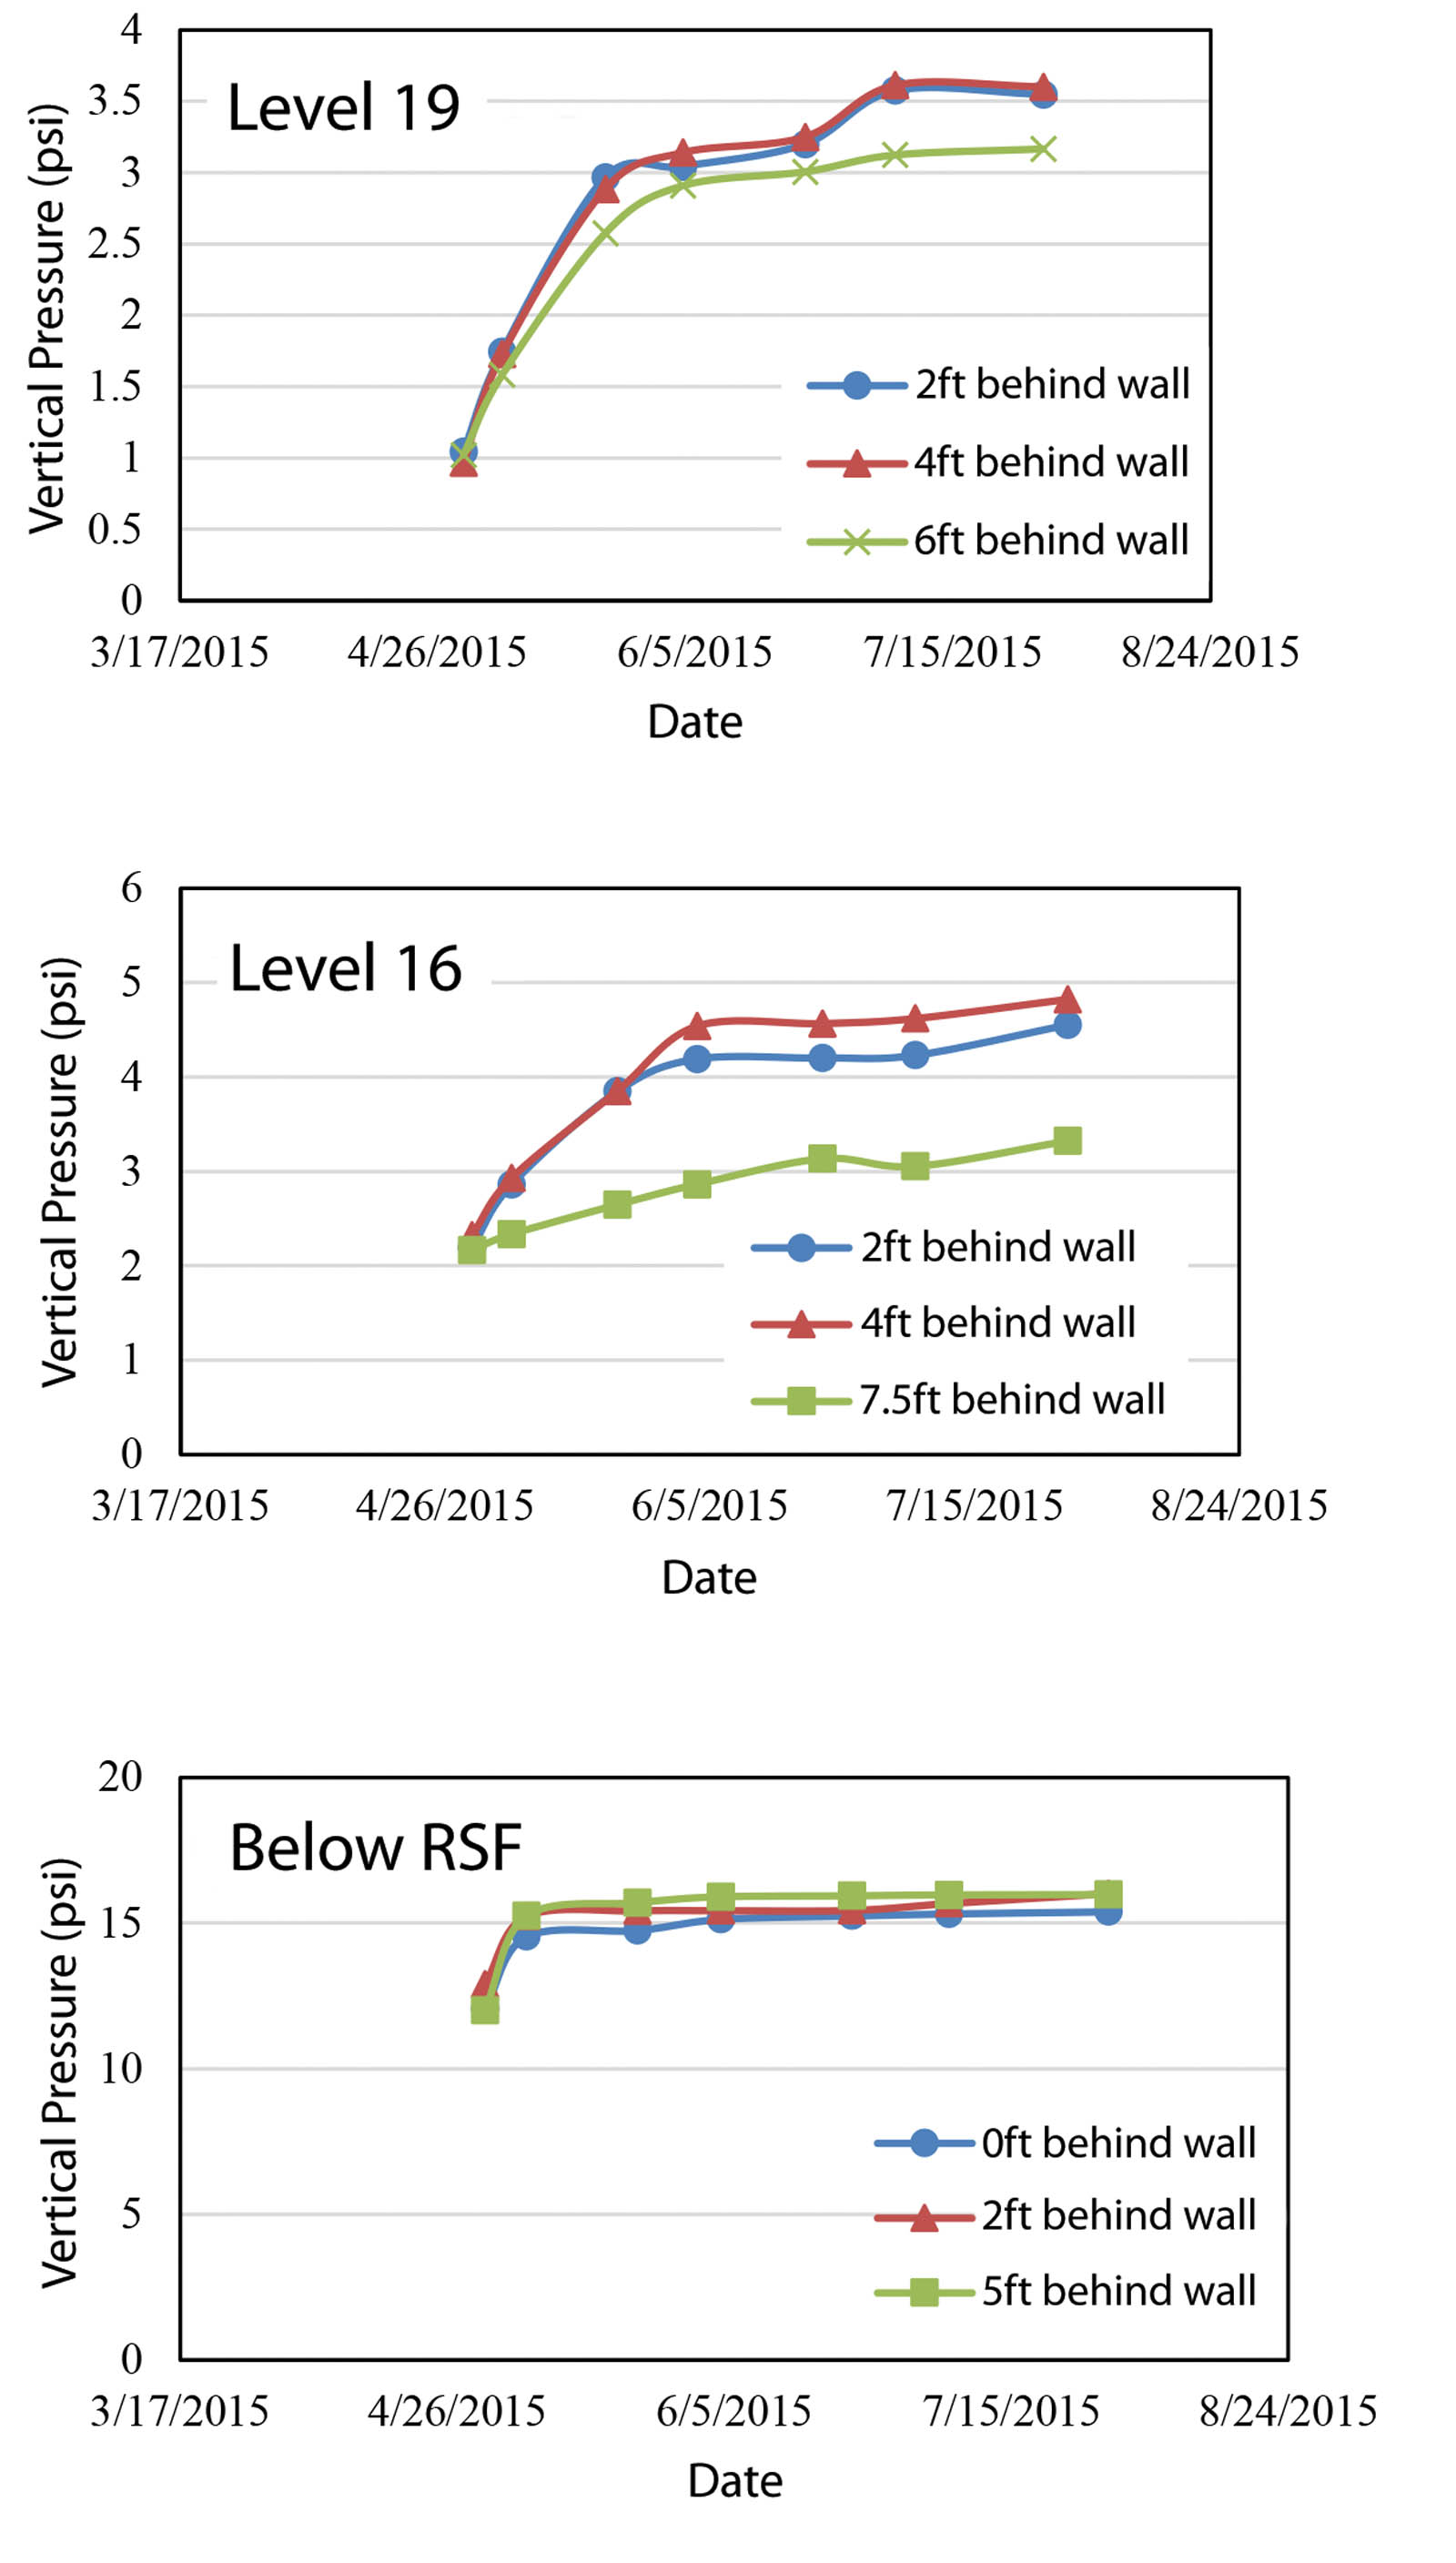
Figures 7a, 7b and 7c depict the measured vertical pressure at different elevations during construction. As expected, higher pressure was observed at lower levels of the bridge. The maximum vertical pressure of 15.9 psi (109.6 kPa) was measured below the RSF. The figures show that, at a certain level, the vertical pressures from behind the wall up to 6 feet (1.8 m) away from the wall are generally very close. However, the pressure cell located at 7.5 feet (2.3 m) away from the wall on Layer 16 measured significantly lower pressure value than the pressure cell close to the wall. The measured vertical earth pressure at the end of the abutment construction was compared to theoretical values. The theoretical values were calculated by multiplying the heights of the backfill above the cells by the average unit weight. The calculated theoretical pressure at the level below RSF, Layer 16 and Layer 19 are 9.7 psi (67 kPa), 3.1 psi (21 kPa) and 1.85 psi (13 kPa), respectively, which compare well with the measured values at the end of abutment construction.
The horizontal total pressure on the wall was measured using pressure cells attached vertically behind the wall. Three pressure cells were installed behind the facing wall on Layer 13, Layer 17 and Layer 20 of the GRS abutment. Figure 8 depicts the measurements of horizontal pressures. The maximum horizontal pressure was observed in the lower level (Layer 13), which is about two times the measured horizontal pressures at the upper layers. The higher value at Layer 13 can be attributed to closer reinforcement spacing. The addition of secondary reinforcement in the top five layers of abutment decreases the reinforcement spacing from 8 to 4 inches (20 to 10 cm). In all three layers, the pressure did not change significantly during construction, which supports the FHWA assumption.
Conclusions
The settlement and deformation measurements of the GRS–IBS exhibited logical and consistent trends. The soil foundation settlement was increased with lift placement, with more movements occurring near the center of the abutment than the corners. The measurements of the abutment deformations indicate that the maximum total settlements across the GRS abutment were significantly less than the design value. The majority of this deformation (~70%) was due to settlement of foundation soil, while less than 30% of the total deformation occurred within the abutment and RSF.
The maximum lateral movement was observed near the top of the wall. Following the construction of the bridge abutment, the facing wall experienced some appreciable outward (away from backfill) lateral displacements. However, after placing the steel girders, the lateral movement close to the wall significantly increased. The measurements from horizontal pressure cells demonstrate that the lateral pressure on the wall face is negligible. In this study, a maximum lateral pressure of 0.8 psi (5.5 kPa) was measured in the lower level of the abutment with no secondary reinforcement layer. The addition of secondary reinforcement within the top layers of the abutment significantly reduced the lateral pressure. Moreover, no significant change in lateral pressure was observed during the construction stages.
Acknowledgments
This research project is funded by the Louisiana Department of Transportation and Development (State SIO No. 30000981) and the Louisiana Transportation and Research Center (Project No. 13-5GT). The help and support of Zhongjie Zhang at LTRC are gratefully acknowledged.
References
Abdoun, T., Bennett, V., Danisch, L., and Barendse, M. (2008). “Real-time construction monitoring with a wireless shape-acceleration array system.” Proc., GeoCongress, 533–540.
Abu-Hejleh, N., Outcalt, W., Wang, T., and Zornberg, G. (2000a). “Performance of geosynthetic reinforced walls supporting the founders/meadows bridge and approaching roadway structures—Report 1: Design, materials, construction, instrumentation, and preliminary results.” Publication CDOT-DTD-R-2000-5, Colorado Department of Transportation.
Abu-Hejleh, N., Wang, T., and Zornberg, G. (2000b). “Performance of geosynthetic-reinforced walls supporting bridge and approaching roadway structures.” Advances in Transportation and Geoenvironmental Systems Using Geosynthetics, ASCE, Reston, VA, 218–243.
Adams, M. (1997). “Performance of a prestrained geosynthetic reinforced soil bridge pier.” Proc., International Symp. on Mechanically Stabilized Backfill, Balkema, Netherlands, 35–53.
Adams, M. T., Kanop K., and Wu, J. (2007a). “Mini pier experiments: Geosynthetic reinforcement spacing and strength as related to performance.” In Geosynthetics in Reinforcement and Hydraulic Applications (GSP 165), M. Gabr and J. Bowders (eds.). ASCE, Reston, VA, 18–21.
Adams, M. T., Nicks, J., Stabile, T., Wu, J. T. H., Schlatter, W., and Hartmann, J. (2011). “Geosynthetic reinforced soil integrated bridge system, synthesis report.” Publication FHWA-HRT-11-027, FHWA, U.S. Department of Transportation.
Adams, M., Nicks, J., Stabile, T., Wu, J., Schlatter, W., and Hartmann, J. (2011). “Geosynthetic reinforced soil integrated bridge system: Interim implementation guide.” Publication FHWA-HRT-11-026, FHWA, U.S. Department of Transportation.
Adams, M., Schlatter, W., and Stabile, T. (2007b). “Geosynthetic-reinforced soil integrated abutments at the Bowman Road Bridge in Defiance County, Ohio.” In Geosynthetics in Reinforcement and Hydraulic Applications (GSP 165), M. Gabr and J. Bowders (eds.). ASCE, Reston, VA, 119–129.
Mohamed, K., Abouzakhm, M., and Elias, M. (2011). “Applications and performance of geosynthetic-reinforced soil abutments on soft subsurface soil conditions.” Transportation Research Record, 2212, Transportation Research Board, Washington, D.C., 74–81.
Pham, T. (2009). “Investigating composite behavior of geosynthetic-reinforced soil (GRS) mass.” Ph.D. dissertation, University of Colorado at Denver.
VanBuskirk, C., and Eng, P. (2010). “Adoption and implementation of GRS design concepts: A consultant’s perspective.” Proc., 19th Vancouver Geotechnical Society Symposium, Geosynthetic Reinforced Walls, Slopes, and Earthworks, Vancouver Geotechnical Society.
Wu, J. (2007). “Lateral earth pressure against the facing of segmental GRS walls.” In Geosynthetics in Reinforcement and Hydraulic Applications (GSP 165), M. Gabr and J. Bowders (eds.). ASCE, Reston, VA, 165–175.
Wu, J., and Helwany, S. (1996). “A performance test for assessment of long-term creep behavior of soil-geosynthetic composites.” Geosynthetics International, 3(1), 107–124.
Wu, J., Ketchart, K., and Adams, M. (2001). “GRS piers and abutments.” Publication FHWA-RD-00-038, FHWA, U.S. Department of Transportation.
Wu, J., Lee, K., Helwany, S., and Ketchart, K. (2006). “Design and construction guidelines for GRS bridge abutment with a flexible facing.” Report No. 556, National Cooperative Highway Research Program.
Wu, J., Yang, K., Mohamed, S., Pham, T., and Chen, R. (2014). “Suppression of soil dilation: A reinforcing mechanism of soil-geosynthetic composites.” Transportation Infrastructure Geotechnology, 1(1), 68–82.
Murad Abu-Farsakh, Ph.D., P.E., F.ASCE, is a research professor and director of the Geotechnical Engineering Research Laboratory at the Louisiana Transportation Research Center in the College of Engineering at Louisiana State University in Baton Rouge.
Milad Saghebfar, Ph.D., P.E., is a research associate at the Louisiana Transportation Research Center in the College of Engineering at Louisiana State University in Baton Rouge.
Allam Ardah, is a Ph.D. candidate in the Department of Civil and Environmental Engineering at Louisiana State University in Baton Rouge.
Qiming Chen, Ph.D., P.E, is a bridge load rating engineer at the Louisiana Department of Transportation and Development in Baton Rouge.