 TEXTILES.ORG

There is a substantial legacy of literature devoted to the design, construction and operation of geomembrane-lined ponds, with perhaps the best and most complete reference being 34 years old by Giroud (1983). Even with this long history, there continue to be problems and failures with lined ponds. One of the problems continuing to plague the industry is that of uplifted geomembrane gas bubbles, also called “whales” or “hippos,” which do not go away in ponds that have an exposed geomembrane. Gas bubbles trapped under the geomembrane have been reported as a problem in the literature for a long time (e.g., Giroud and Goldstein 1982, Giroud 1983, Koerner 1994, U.S. EPA 1991, Sharma and Reddy 2004, Wallace et al. 2006, and Peggs 2006a and 2006b).
Specific problems that occur due to the presence of geomembrane gas bubbles include (a) the loss of effective pond volume above the geomembrane, (b) opening up of greater areas of subgrade infiltration to leakage that may occur through defects in the geomembrane, (c) increased susceptibility of the geomembrane to mechanical damage caused by raising the geomembrane closer to or above the pond liquid surface, (d) poor aesthetics for decorative ponds, and (e) debilitating stretching of the geomembrane due to the stresses and strains caused by the gas pressure, even to the point of bursting the geomembrane.
Thiel (2016a) recently provided analytical methods to allow design practitioners to predict the size, shape and pressure of gas bubbles. Thiel (2016b) extended this work to provide design and operational solutions for managing bubbles. Outside of some literature references presenting bubbles as a problem, and offering general qualitative design advice to provide pond-bottom slope and subgrade venting, the author believes those are the first references to provide reliable and specific methods of quantitative analysis to address the management of geomembrane gas bubbles. Such analyses are valuable to understanding both the stresses and strains that might be caused by gas bubbles and the bubble mechanics so that engineering design solutions can be optimized rather than guessed.
Part 1 of this 3-part series outlines the potential causes of gas accumulation and bubble formation below geomembrane pond liners. A double-iteration analytical method is outlined to quantify the size, shape and pressure of a gas bubble in a geomembrane, where the pressure is entirely caused by the external static liquid forces in the pond on the outside of the bubble. Parts 2 and 3 examine the detailed considerations required for design and/or operational mechanisms to relieve gas bubbles.
The subject of this series is focused on ponds with exposed geomembranes that are not ballasted. Certainly ballast, such as a soil layer, would be an effective method to control gas uplift pressures. That being said, there are many reasons that owners and operators often prefer not to place ballast on top of the pond liners including cost, ease of cleaning, ease of the removal of sludge and accessibility for making repairs. The fact is that there are many geomembrane-lined ponds, perhaps the majority, that are unballasted.
Unballasted geomembranes are susceptible to uplift by fluid pressures from below. The uplifting fluid pressures can be caused by either liquids (e.g., high groundwater) or gases—and sometimes both. The design solutions for liquid uplift are different from, but can potentially overlap, the design solutions for gas uplift. Common design solutions for both liquid and gas uplift pressures can include the use of ballast on top of the geomembrane and underdrains below the geomembrane. As the subject of this series is focused on gas uplift, no further discussion of design considerations for the control of uplift pressures by liquids are included herein.
Causes of geomembrane bubbles in ponds
There are several possible origins of gases below pond geomembranes.
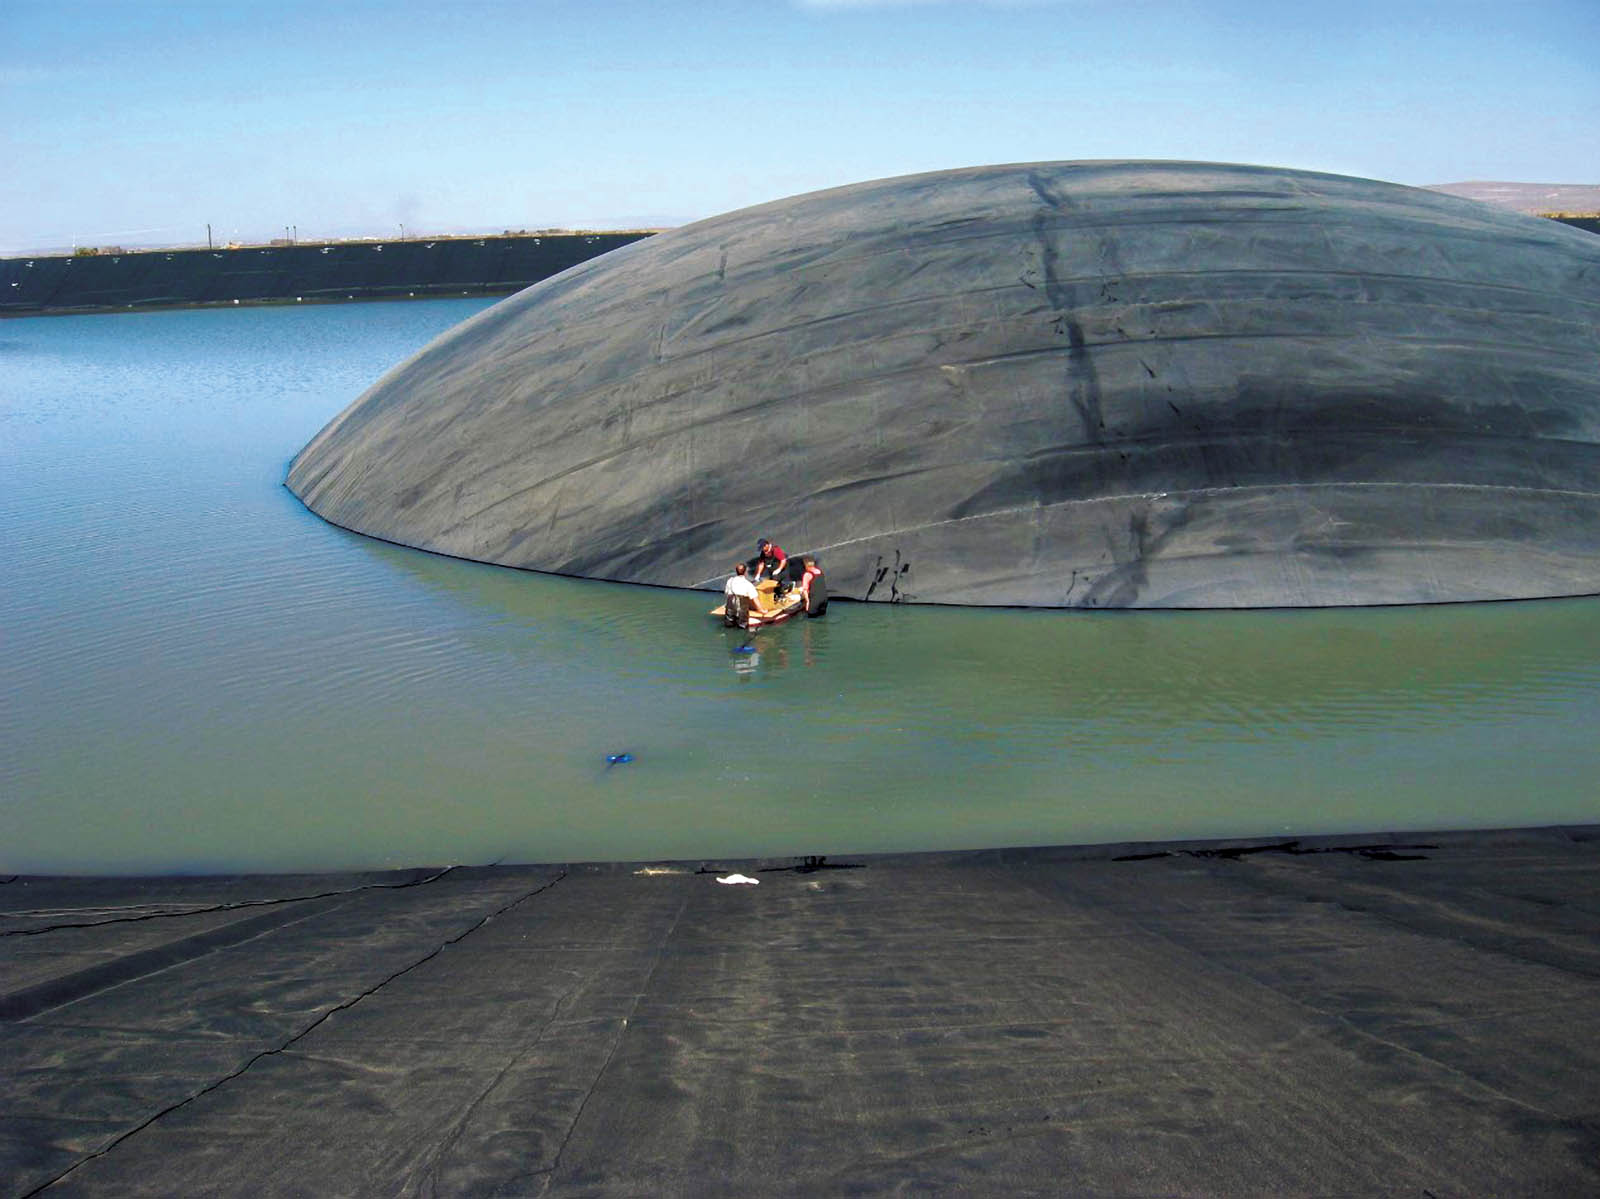
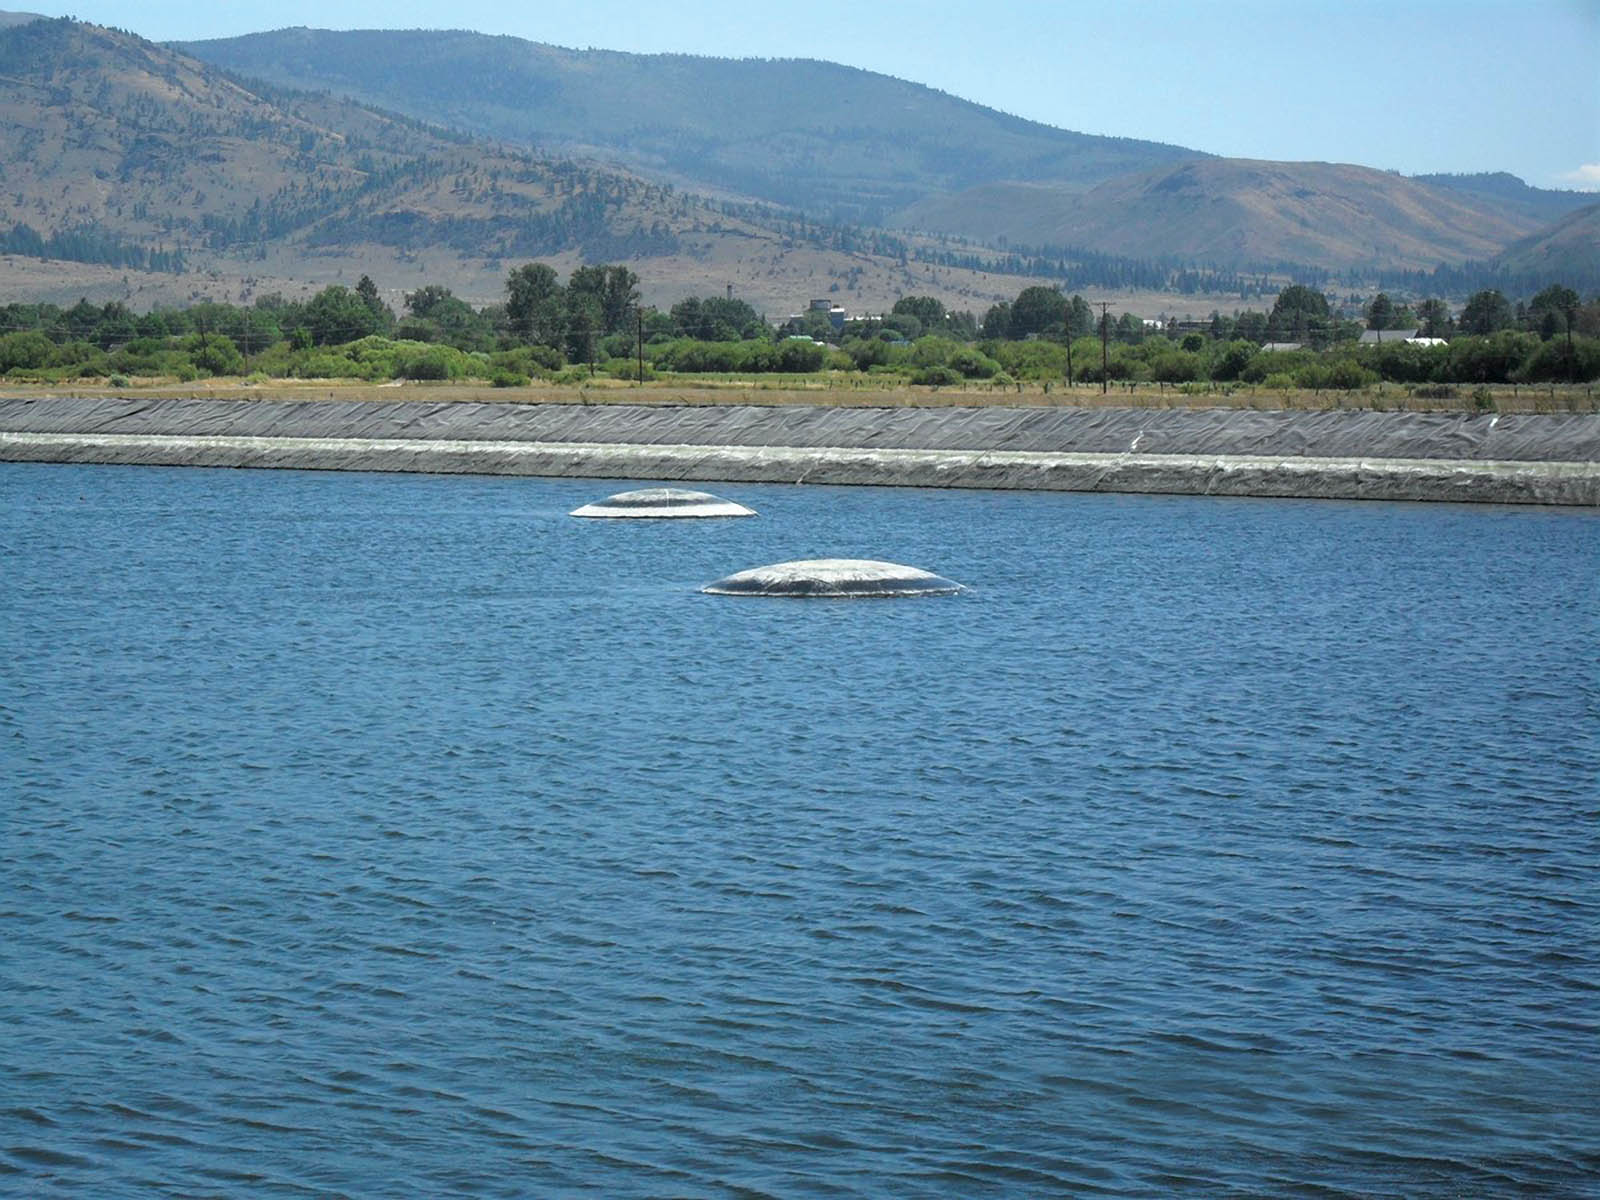
Perhaps the most common source is air that is initially trapped below the geomembrane during installation. It is well known and accepted that numerous wrinkles typically exist at the end of geomembrane installation. Normally, air exists below all of these wrinkles. As a pond is filled with liquid, the air may try to escape through the subgrade, but if it is not allowed to escape because of a saturated or low-permeability subgrade, then the air will become pressurized by the surrounding liquid and form a bubble. Adjacent wrinkles and air pockets will tend to coalesce into larger bubbles. A dramatic example of a large bubble took place in a wastewater effluent project in Southern California, in which 32-ha (80-acre) ponds with flat bottoms were constructed on silty, fine-grained sand well above groundwater. The construction of a single high-density polyethylene (HDPE) geomembrane liner for these ponds resulted in significant trapped air whose pressure could not be relieved through the underlying soils that were saturated with capillary-held construction water and were thus relatively impermeable to the passage of air. During the filling of these reservoirs, the trapped air coalesced into several large bubbles (Figure 1). Because of anchor trenches in the pond bottom, which were designed to resist wind uplift when the reservoirs are empty, there was no possibility of “walking” the bubbles to the slopes for venting. The bubbles had to be pierced and vented with specially designed vents. Once vented, though, the bubbles never returned.
Another potential mechanism for air collection below liners that is discussed in references going back to the early 1980s (e.g., Giroud and Goldstein 1982) is the cyclic rise and fall of groundwater. This mechanism is difficult to prove, but conservative project-specific estimates could be calculated by assuming that the air in the soil pores is displaced upward as a result of rising groundwater.
Gases can be generated by decomposition of organic materials existing in the subgrade soils, by organic vapors that naturally off-gas from chemicals in the soil or by chemical reactions that may exist in the subsoils (Giroud 1983).
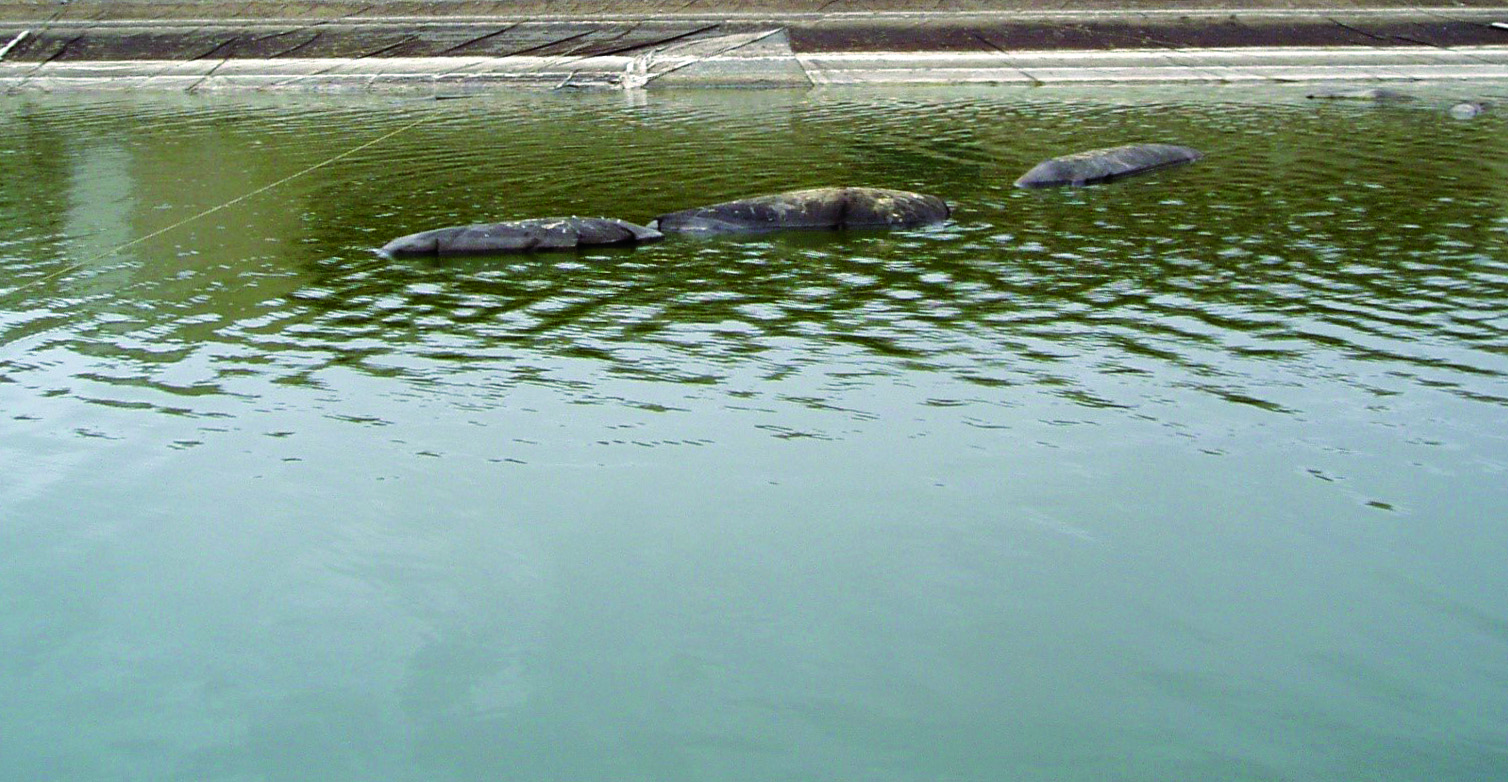
There are many instances of gas being trapped below liners in wastewater ponds as a result of biologically active liquid that gets between the geomembrane and the underlying subgrade, usually via leaks in the geomembrane (example shown in Figure 2). This is discussed in the references by Peggs (2006a and 2006b) and Giroud (1983).
Geometry

The assumed geometry of a bubble in the pond, surrounded by a liquid of depth H, is shown in Figure 3. This geometry is different from the standard laboratory multiaxial burst test because the bottom perimeter of the bubble in a pond is not hard clamped but is shown with a reverse curvature, with a point-of-inflection (POI) located a distance (n) above the pond bottom. The depth of the POI below the pond liquid level, given by the quantity H-n, is not initially known but can be calculated based on certain assumptions.
The top of the pond bubble is assumed to be circular. This circular geometry, at least for the portion of the bubble above the water surface, has been shown to exist in laboratory testing, has been observed in field situations, and would be expected for a membrane that is uniformly pressurized and symmetrically held (Bray and Merry 1999). The upper portion of the bubble above the POI is assumed to have a uniform radius (R1), and the diameter at the POI (c1).

For the portion of the bubble below the POI, it is logical that the geomembrane would experience a reverse curvature that would eventually become tangent to the pond floor. Since the base of the bubble is not hard clamped as it is in most laboratory tests, the curvature would be more gentle and with a smoother transition than in the laboratory-clamped case. The questions related to the shape of the bubble curvature below the water surface are: (a) what type of curvature would exist below the water level, and (b) how can the location of the POI be estimated? To answer these questions, we can begin by considering the force equilibrium in a free-body diagram of a very small segment of the bubble surface, as illustrated in Figure 4.
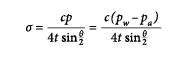
On the segment, the surface could
be assumed to have a circular curvature. That is to say, for example, that if the actual curvature is a spiral or exponential relation, it can be considered to be circular on a small, localized basis. The forces on this bubble segment include the internal air pressure (pa), which is considered constant everywhere inside the bubble; the external water pressure (pw), which increases linearly with depth; and the geomembrane tensile stress (σ), which is assumed to be equal on both ends of the segment under consideration. Using the geometric relations of a pressurized membrane segment with a radius of curvature (R), central angle (θ), chord length (c), thickness (t), experiencing a net pressure (p) equal to the difference between pw and pa, the force equilibrium of the segment is well documented (e.g., ASTM D5617) as:
(1)
Noting from geometry that:
(2)
then
(3)
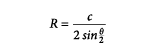
Solving for R we find:
(4)
There are two significant implications of Equation 4. The first implication is that when pa = pw, then R will tend toward infinity. When R is infinity, there is no curvature, and this would be the POI. Thus, the POI will exist where:
![]()
(5)
where γw is the unit weight of the surrounding liquid. This conclusion indicates that at the point where the external liquid pressure is equal to the internal bubble pressure, there is no curvature on the bubble surface, which is somewhat intuitive and makes sense.
The second implication of Equation 4 is that R below the water level will vary linearly with the depth below the POI. The type of curve whose R varies linearly with the length along the curve is called a “clothoidal spiral.” While a linear variation of curvature with the depth of liquid is not exactly the same thing as a linear variation with the length along the curve, the relationship is close enough to use as a first approximation for purposes of assigning a mathematical model for the shape of the curvature.
Using these geometric assumptions, Thiel (2016a) presents an iteration method of analysis to estimate the stresses and strains in the geomembrane that are caused by a balance of the external fluid pressures and the internal gas pressure. The specific solution for a particular geomembrane material requires a second round of iteration, where the challenge is that of matching the calculated multiaxial stress and strain in the bubble to the material properties of the desired geomembrane. This is done by iteratively changing geometric parameters of the bubble shape until the stress and strain match the specific properties for the assumed geomembrane being analyzed.
Discussion of results
Using the approach summarized above, and as described in detail in Thiel (2016a), the author has performed these calculations for various size bubbles for a 1.5-mm (60-mil) HDPE geomembrane material to estimate what range of diameters (D) would exist at the base of a bubble on the pond floor at various liquid depths. As mentioned previously, this approach requires the practitioner to define a critical point on the geomembrane material’s stress-strain curve. Based on the most conservative, very slowly strained multiaxial tests on 1.5-mm (60-mil) HDPE reported by Nobert (1993), the following two states were evaluated for this material: (1) “Ultimate” state where bursting may eventually occur. In this state, it is assumed that the average strain calculated in the upper portion of the bubble is approximately 12.4% and the stress on a 1.5-mm (60-mil) HDPE geomembrane is approximately 10,000 kPa (1,450 psi). This level of strain is achieved when the central angle on the upper portion of the bubble is θ = 95 degrees. (2) Transient “allowable” state, presumed where the strain is 3.7% (θ = 53 degrees), and the corresponding stress is approximately 6,500 kPa (943 psi). Certainly, other combinations of stress and strain could be chosen for different site conditions, geomembranes and assumptions. The results of parametric analyses are presented in Table 1. Noteworthy observations include:
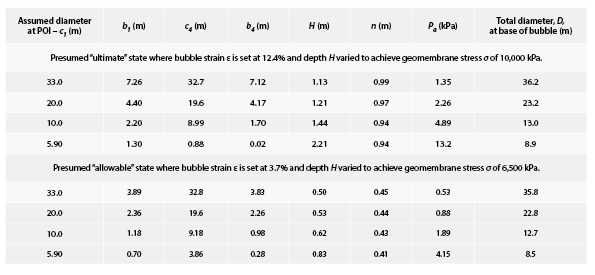
The smallest bubble that was calculated to achieve potential “burst” conditions for a 1.5-mm (60-mil) HDPE geomembrane has a total D of 8.9 m (29 ft). This could be useful information for designing spacing of underdrain strips, which should be spaced closer than 8.9 m (29.2 ft) in this case. This bubble would exist in 2.17 m (7.1 ft) of water and only have 0.07 m (0.22 ft) projecting above the water surface, with an internal pressure of only 13 kPa (1.9 psi). An actual case reflective of this situation, where the approximate estimated bubble dimensions and liquid depth seem to validate the analyses presented in this article, is shown in Figure 5.
The larger the bubble, the lower the critical water depth and the lower the critical internal pressure. The estimated size and water depth for a very large bubble predicted by the author’s approach, with a D of 33 m (108 ft) at the POI in a water depth of 1.13 m (3.7 ft), appears to be validated by the field condition shown in Figure 1.
Perhaps one of the most useful take-home messages is how dangerous relatively low bubble pressures can be for the geomembrane. Consider that a 33-m (108-ft) diameter bubble that would potentially be on the verge of bursting would only have an internal pressure of 1.4 kPa (0.2 psi), caused by only 1.13 m (3.7 ft) of water depth. Such a real-world situation is shown in Figure 1. Indeed, when the bubble shown in Figure 1 was pierced by attachment of a valved penetrating pipe, the event was undramatic, meaning there was not a sudden gush of air pressure and deflation was very slow.
Discussion of bubble shape and strains
As engineers and design practitioners, we are often faced with exercising skilled judgment when dealing with an inexact science in anticipation of factors that cannot be precisely measured. Certainly, there are many aspects of the approach described in this article where engineering judgment and theory are combined to arrive at a means of suggesting a quantitative engineering approach. Some of the areas requiring judgment are described further in Thiel (2016a).
In Parts 2 and 3 of this series, we will use the understandings of the bubble shape, geometry, stresses and strains from Part 1 to derive engineering and operational solutions for managing bubbles based on a quantifiable analytical approach.
Richard Thiel, P.E., is the president of Thiel Engineering in Oregon House, Calif.
ASTM D5617. (2015). “Standard test method for multi-axial tension test for geosynthetics.” Annual Book of ASTM Standards, 04.13. American Society for Testing of Materials, West Conshohocken, Pa.
Bray, J. D., and Merry, S. M. (1999). “A comparison of the response of geosynthetics in the multiaxial and uniaxial test devices” Geosynthetics International, 6(1), 19–40.
Giroud, J. P. (1983). “General report on geomembrane-lined reservoirs.” C. R. Colloque sur l’Etanchéité des Ouvrages Hydrauliques, Paris, France (in French).
Giroud, J. P., and Goldstein, J. S. (1982). “Geomembrane liner design.” Waste Age, 13(9), 27–30.
Koerner, R. (1994). Designing with Geosynthetics, 3rd ed., Prentice Hall, Englewood Cliffs, N.J.
Nobert, J. (1993). “The use of multi-axial burst test to assess the performance of geomembranes.” Proc., of Geosynthetics 1993, 2, Industrial Fabrics Association International, Saint Paul, Minn., 685–702.
Peggs, I. (2006a). “Whales: A recurring geomembrane liner problem.” Canadian Environmental Protection, 18(1).
Peggs, I. (2006b). “The pond edge: Geomembrane liners in wastewater treatment ponds: Whales, and their prevention.” Land and Water Magazine, 50(4).
Sharma, H. D., and Reddy, K. R. (2004). Geoenvironmental Engineering, Wiley & Sons, Hoboken, N.J.
Thiel, R. (2016a). “Analysis of stresses and strains in geomembrane gas bubbles that occur in surface impoundments.” Proc., Geo-Chicago 2016, American Society of Civil Engineers, Reston, Va.
Thiel, R. (2016b). “Recommendations for design of exposed geomembrane-lined ponds to control uplifting gas pressures.” Proc., Eurogeo6, International Geosynthetics Society, Jupiter, Fla.
U.S. EPA. (1991). Technical resources document: Design, construction, and operation of hazardous and non-hazardous waste surface impoundments, EPA/530/SW-91/054, ORD.
Wallace, R., Giroud, J. P., and Shanks, M. (2006). “Impacts of construction practices and reservoir filling on geomembrane uplift.” Proc., 8th International Conference on Geosynthetics, 2, International Geosynthetics Society, Jupiter, Fla., 615–618.
At Clearwater Bay in Hong Kong when John Cowland and I knew there was a potential for air entrapment due to the fissured limestone subgrade we were able to install an underliner ventilation system to prevent hippos from forming.
However in a recent conversation with an unnamed landfill operator in Asia I was told that ‘we got rid of those hippos’. When I asked how I was told that the solution was a 12 guage shot gun. Oh Well.
More seriously I should refer readers to the paper by Fred Gassner at the ICG in Berlin.