 TEXTILES.ORG

By Bruce Lacina and Melissa Medlin
1. Introduction
The ASTM international standard test method for pore size characteristics of geotextiles by capillary flow test provides a wealth of information about the physical makeup of the structure and pore spaces in a geotextile sample. This test is often referred to as the pore size distribution (PSD) test for geotextiles. The information this test provides compared with other ASTM geotextile tests makes its use an attractive option for geosynthetic testing laboratories to run in lieu of running multiple other tests to get the same product information. When testing a plain-weave woven geotextile, the PSD test can provide more accurate (lower variability and error) and nearly identical test results to each of the individual test methods: ASTM D4751 (apparent opening size, AOS); D4491 (hydraulic flow properties); and COE–22125-86 (percent open area, POA). By running a PSD test on a geotextile sample to get these multiple geotextile physical properties from the other ASTM test methods combined, laboratories can potentially save valuable personnel and time resources to improve their testing efficiencies and profitability.
2. Potential cost savings to testing laboratories
2.1 Initial costs
The startup costs related to bringing a commercial PSD testing device (called a porometer) into a testing laboratory were prohibitive until recently.
Initially, porometers that cost $40,000 to $60,000 were the norm and they often had to be modified to work properly for geotextiles, which have much more open structures than the filter materials for which these porometers were developed to test. Today there are porometers in the U.S. marketplace that have been specifically developed for testing geotextiles that are available for less than half of the early porometer prices.
Current pricing now brings the porometer into a more affordable price range for geosynthetic testing labs, which has initiated a vast interest in the testing capabilities of these instruments.
2.2 Laboratory testing efficiencies, time, and personnel cost savings
The PSD test can provide significant improvements in laboratory testing efficiencies and accuracy over running the industry standard geotextile tests mentioned earlier.
The PSD test is straightforward to perform once testing parameters have been established and the data are simple to collect and analyze compared to the other geotextile tests it can replace or supplement. The collected test data results do not leave much to interpretation for personnel, which can lower the overall testing errors and variability.
However, the greatest improvement is that laboratory personnel can calculate different types of information from a single data set of samples instead of running separate data sets for three separate tests, which have to be properly prepped, tested, and reported.
Compared to the temperature and pressure sensitive water sources that laboratories have to rely on to test the hydraulic properties of geotextiles using ASTM D4491, the consistency of the wetting fluid(s) used in porometer testing can provide much more reliable test results. Due to the lab’s water storage locations and containers, the oxygen content in the water and other possible contaminants can easily influence data collection and provide erroneous results on a day-to-day basis. The wetting fluid(s) used in PSD testing do not have these issues and use a much smaller volume of liquid for each test. Thus, the porometer can provide more consistent hydraulic flow properties when testing geotextiles in a short period of time.
The PSD test can be used to accurately determine the largest opening (the bubble point), the smallest opening, and the full range of openings in-between (pore size distribution). Unlike PSD, ASTM D4751 (AOS) is simply used to determine the O95 of a geotextile sample as shown in Table 1. The PSD test is much easier to setup and run than the AOS test, in which the geotextile samples can get distorted during the lengthy sample preparation, testing can suffer from electrostatic issues, and glass beads can become lodged in the geotextile samples providing erroneous results. Thus, the porometer can provide more consistent and complete opening size information for a geotextile sample in a shorter testing period.
| Style | O95 (mm) from porometer ASTM D6767 | O95 (mm) from AOS ASTM D4751 | POA porometer ASTM D6767 |
COE-POA COE-02215 | Permittivity, sec-1 porometer ASTM D6767 |
Permittivity, sec-1 ASTM D4491 |
| Woven monofilament geotextile | 0.277 | 0.300 | 5.9 | N/A | 1.20 | 1.17 |
| Woven monofilament with tape filling | 0.386 | 0.425 | 5.7 | 5.0 | 0.68 | 0.78 |
| High-strength woven monofilament with tape filling | 0.421 | 0.425 | 5.0 | N/A | 0.71 | 0.74 |
TABLE 1: Comparison of porometer calculated data to the equivalent ASTM or COE tests.
Utilizing the porometer to replace the outdated and inaccurate COE-POA method would be a welcome change in the geotextile testing industry. Using the COE-POA method to measure the percent open area of a geotextile is nearly impossible due to lack of availability of the testing device (projector). Performing the COE test is arduous, time consuming, and requires significant experience to obtain meaningful results. The porometer test may provide the percent open area of a monofilament geotextile that is more accurate and precise than the qualitative result from the COE-POA method, but can be very different for more complex weaves. There can be significant influences on the amount of light coming through the specimens that greatly change the COE-POA results.
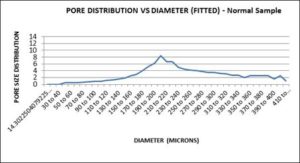
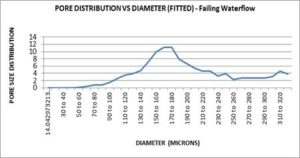
An added bonus to using the porometer is the discovery that all woven geotextiles have a specific porosity “fingerprint” that can be utilized to determine weaving anomalies. As seen in Figure 1, the normal monofilament, plain weave geotextile has a single peak graph that is indicative of the pore distribution. The highest peak occurs at 210–220 microns and has a distinctive appearance. Upon discovery of a failing sample of the same style as seen in Figure 2, the peak is less pronounced and shifted to the 170–180 micron range. This information can be presented to manufacturing personnel and used as evidence that a change has occurred in the manufacturing process. The changes can be identified and the graph used to predict even minor shifts. Neither AOS nor COE–POA can provide this type of data because of the restrictive nature of the information from these two test methods.
There is also a significant potential cost savings to testing laboratories based on the number of tests they would need to perform using the porometer vs. running the individual ASTM tests. Based on running six samples per day, the estimated annual cost for ASTM D4751, ASTM D4491, and POA is $230,000. The estimated annual cost to obtain the same (though more precise, accurate, and complete) test data using a porometer (ASTM D6767) for six samples per day is approximately $110,000. The resulting savings to the lab by using the porometer vs. the individual tests is $120,000 for this example.
3. Putting porometer data into use in design and specifications
3.1 Pore size distribution data vs. AOS
When selecting the appropriate textile for soil filtration, civil engineers typically rely on the AOS (O95) value of a geotextile. AOS values can be misleading since they primarily identify only the largest opening(s) in the geotextile.
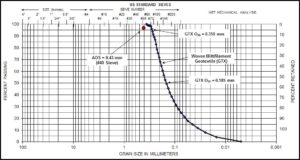
While it may give the designer or specifier an idea of the retention value of the geotextile, the test itself is inherently inaccurate. The AOS test provides an indirect measurement that reports only one opening size value, and a pore size distribution of the geotextile cannot be obtained using ASTM D4751. An example of the clear difference in the data reported using both test methods is shown in Figure 3.
Several filtration design methods have been developed through the years to provide a way for civil engineers to be able to use a geotextile’s AOS value to assess its filtration capacity for a candidate soil in a specific application. The project specific design application will have: either one or two directional water flow through the geotextile; the water flow will be either laminar (steady state) or turbulent (dynamic); the application will have a target head of water pressure (gradient); the geotextile will experience light to moderate to heavy installation and service state stresses.
Yet, the filtration designer has to rely on a single AOS data point to provide all the requisite geotextile filtration information for design. This design paradigm is similar to a person having to describe a tree by using a single leaf. Civil engineers and other geotextile filtration designers using just an AOS value for the geotextile should be uncomfortable knowing now that their filtration designs have been lacking.
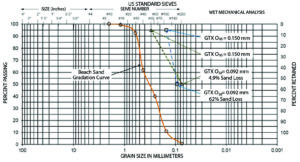
An example of the shortcomings of the current design paradigm can easily be illustrated. For this example, a woven geotextile was selected to filter a sand soil in turbulent or dynamic flow conditions allowing no more than 5% particle loss through the geotextile. Using industry standard filtration design conventions for the particle size distribution of the sand, a suitable AOS was determined for the geotextile of 150 μm (#100 sieve). Large scale lab testing of the geotextile filtration system showed that 6.2% of sand particles were hydraulically transported through the geotextile, which was an unacceptable level of particle loss.
A second geotextile with an AOS of 300 μm (#50 sieve) was chosen as a candidate filter for the sand and was tested using the large scale testing device. This geotextile retained 4.9% of sand particles and was deemed appropriate for the application by the project engineer. The grain size distribution plot of the beach sand showing the O95 and O50 for each of the geotextiles used in this example are shown in Figure 4. What separated the performance of the geotextiles was not the counterintuitive nature of their AOS values based on performance, but their average size of all their openings. The geotextile with an AOS (O95) of 150μm had an average opening size (O50) of 92μm, while the geotextile with an O95 of 300μm had an O50 of 74μm.
Performing the ASTM D4751 test on these geotextiles did not provide the information required to make an informed choice for the geotextile filter for this project. The PSD information (O95 O50) obtained using ASTM D6767 provided the critical opening size data to compare to the sand particle size distribution to make an educated choice for the most suitable geotextile filter.
It is easy to see that the ASTM D6767 porometer test provides magnitudes more information on the PSD of the openings in a geotextile. It provides the largest opening, called the bubble point: the O95 or AOS; the O90, O80 … O40, O30 and can be used to determine the smaller opening (O20 and O10) sizes reliably for most geotextiles. In addition, several filtration design methods have been developed over the years that use the PSD of a geotextile in their filtration analyses. Since there has not been enough industry consensus to be able to create an ASTM testing standard for the porometer until recent years, these PSD filtrations methods are tied to their specific porometer devices and wetting fluids and the geotextiles that were tested. In qualified hands, a unified PSD filtration design method based on current ASTM D6767 PSD test results using modern porometers, wetting fluids geotextiles would be fairly simple to create and gain industry acceptance.
3.2 Specifying PSD vs. AOS values
Specifying the material properties of a geotextile based on PSD instead of AOS is fairly easy to achieve.
The O95 of the geotextile is nearly identical to the AOS value obtained from running ASTM D4751, with an exception. Geotextile manufacturers typically run the AOS test on their geotextiles to get a pass/fail value, and not a full AOS test. The reason this is done is due to the cost prohibitive nature of running a full bead gradation analysis for every geotextile sample tested from a lot (the statistical sampling size).
The cost of replacing the glass beads used for testing is expensive and re-sieving beads into their appropriate size classes after every test is time consuming, as well as the extra time needed to account for the glass beads that get caught in the geotextile samples during each test. This means that they will select a single bead size representing the AOS value the geotextile was manufactured to meet. For a geotextile that was manufactured for a target AOS value of 212μm (#70 sieve), the geotextile samples tested will use only 212μm beads in the test. If 95% of the beads are retained by the geotextile samples, the sample passes; if fewer than 95% of the beads are retained, the sample fails. Using the pass/fail method is much more efficient for manufacturing.
The PSD values obtained from ASTM D6767 testing are more complete and can account for the largest opening in a geotextile, as well as the smaller and tortuous interstices. Therefore, it is more accurate and precise to use PSD values in geotextile specifications, especially when considering the end use of the geotextile may include applications where dynamic or turbulent hydraulic forces are in effect, such as saturated roadways, shore and stream linings, dams, and other aqueous environments.
It is recommended when specifying PSD values that the ASTM D6767 tested O95 and O50 values and the ASTM D4751 tested AOS value should be presented in geotextile specifications for filtration applications. The recommendation for specifying both the AOS and O95 should provide designers and specifiers a level of comfort against the newness of PSD test data in the industry.
Even though there is good correlation between the O95 obtained from AOS testing and the O95 from PSD testing, they will probably not be identical. This is due to the AOS test 1033 using a round glass bead against the openings in the geotextile’s structure (i.e., trying to fit a round peg into a square hole) and the PSD test measuring the actual shape of the openings in the geotextile’s structure. A specification example of woven geotextile mechanical properties including AOS and PSD data is given in Table 2.
| Mechanical Properties | Test Method | Unit | Minimum Average Roll Value |
| STRENGTH | |||
| Wide width tensile strength | ASTM D4595 | lb/in (kN/m) | 400 (70.0) |
| CBR puncture | ASTM D6241 | lb (N) | 1950 (8677.5) |
| HYDRAULIC | |||
| Flow rate | ASTM D4491 | gal/min/ft2 (l/min/m2 ) | 75 (3055.5) |
| Permittivity | ASTM D4491 | sec-1 (1/sec) | 1.0 |
| SOIL RETENTION | |||
| Apparent opening size (AOS)A | ASTM D4751 | U.S. sieve (mm) | 40 (0.43) |
| Pore size O95 | ASTM D6767 | microns | 350B |
| Pore size O50 | ASTM D6767 | microns | 185B |
| SOIL INTERACTION | |||
| Interaction coefficient | ASTM D6706 | 0.9 | |
| UV resistance (at 500 hours) |
ASTM D4355 | % strength retained | 80 |
| AASTM D4751: AOS is a maximum opening diameter value BTypical values | |||
TABLE 2: Example filtration geotextile mechanical properties including AOS and PSD test result values.
4. Conclusions
The contents and discussion provided in this document have illustrated that the test data and results obtained from testing geotextiles using the ASTM D6767 appear to make it the most efficient, accurate, and precise test method to use to obtain the necessary information regarding the configuration of the openings, hydraulic flow capabilities, and the open area of a geotextile.
In effect, its use can supplement and/or replace three other geotextile tests in the testing laboratory, increasing the lab’s throughput and reducing error. The PSD data obtained from testing are more useful to civil engineers and other geotextile filtration designers in its accuracy and complexity than the AOS value. It is such a valuable tool that one would expect that the geosynthetics and civil engineering communities will continue to move forward with their adoption of the porometer test and the application of its test results.
Bruce Lacina, P.E., TenCate Geosynthetics, USA, b.lacina@tencate.com
Melissa Medlin, TenCate Geosynthetics, USA, m.medlin@tencate.com
Acknowledgements
Trent Smith, Clarkesville, Ga.
Shobha K. Bhatia, Department of Civil and Environmental Engineering, Syracuse University
Barry Christopher, Christopher Consultants, Roswell, Ga.
David J. Elton, Civil Engineering Department, Auburn University
Richard Lacey, TRI Environmental Inc., Austin, Texas
Eric Blond, Groupe CTT Group, Quebec, Canada
References
ASTM D 4491. Standard Test Methods for Water Permeability of Geotextiles by Permittivity,
American Society for Testing and Materials,
West Conshohocken, Pa., USA.
ASTM D 4751. Standard Test Method for Determining Apparent Opening Size of a Geotextile, American Society for Testing and Materials, West Conshohocken, Pa., USA.
ASTM D 6767. Standard Test Method for Pore Size Characteristics of Geotextiles by Capillary Flow Test, American Society for Testing and Materials, West Conshohocken, Pa., USA.
COE-22125. Geotextile Percent Open Area, U.S. Army Corps of Engineers, Vicksburg, Miss., USA.